4 Results
4.1 Measuring pretense quality
As a first measure of pretense quality, we compared the total number of guesses in pretend and non-pretend games. Among Battleship players, the number of cell selections was similar in pretend (mean = 15.83, SD = 2.91) and non-pretend games (mean = 16.05, SD = 2.18; \(t(499) = -1.43\), \(p = .153\); Cohen’s \(d\) = 0.06; Fig. 4.1A). 20 pretenders who immediately discovered all ships without making errors were excluded from all further analyses, in accordance with our pre-registered plan. With these subjects excluded, the number of cell selections remained very similar in pretend (mean = 16.11) and non-pretend games (mean = 15.94; \(t(479) = 1.39\), \(p = .164\); Fig. 4.1A). In Hangman, pretenders tended to make about one additional letter guess on average than did non-pretenders, controlling for word length (pretend: 2.80 misses, SD = 2.77; non-pretend: 1.94 misses, , SD = 1.76; \(t(500) = 6.47\), \(p < .001\); Cohen’s \(d\) = 0.29; Fig. 4.1B). Despite an overall bias in the number of guesses, pretend Hangman games showed a near-perfect item-specific alignment: pretenders were successful in making more incorrect letter guesses when attempting to reveal words that would have been harder to guess had they been playing for real (\(r_{\mathrm{s}} = .97\); Fig. 4.1B). This strong correlation provides evidence for a human capacity to act in accordance with a counterfactual knowledge state.
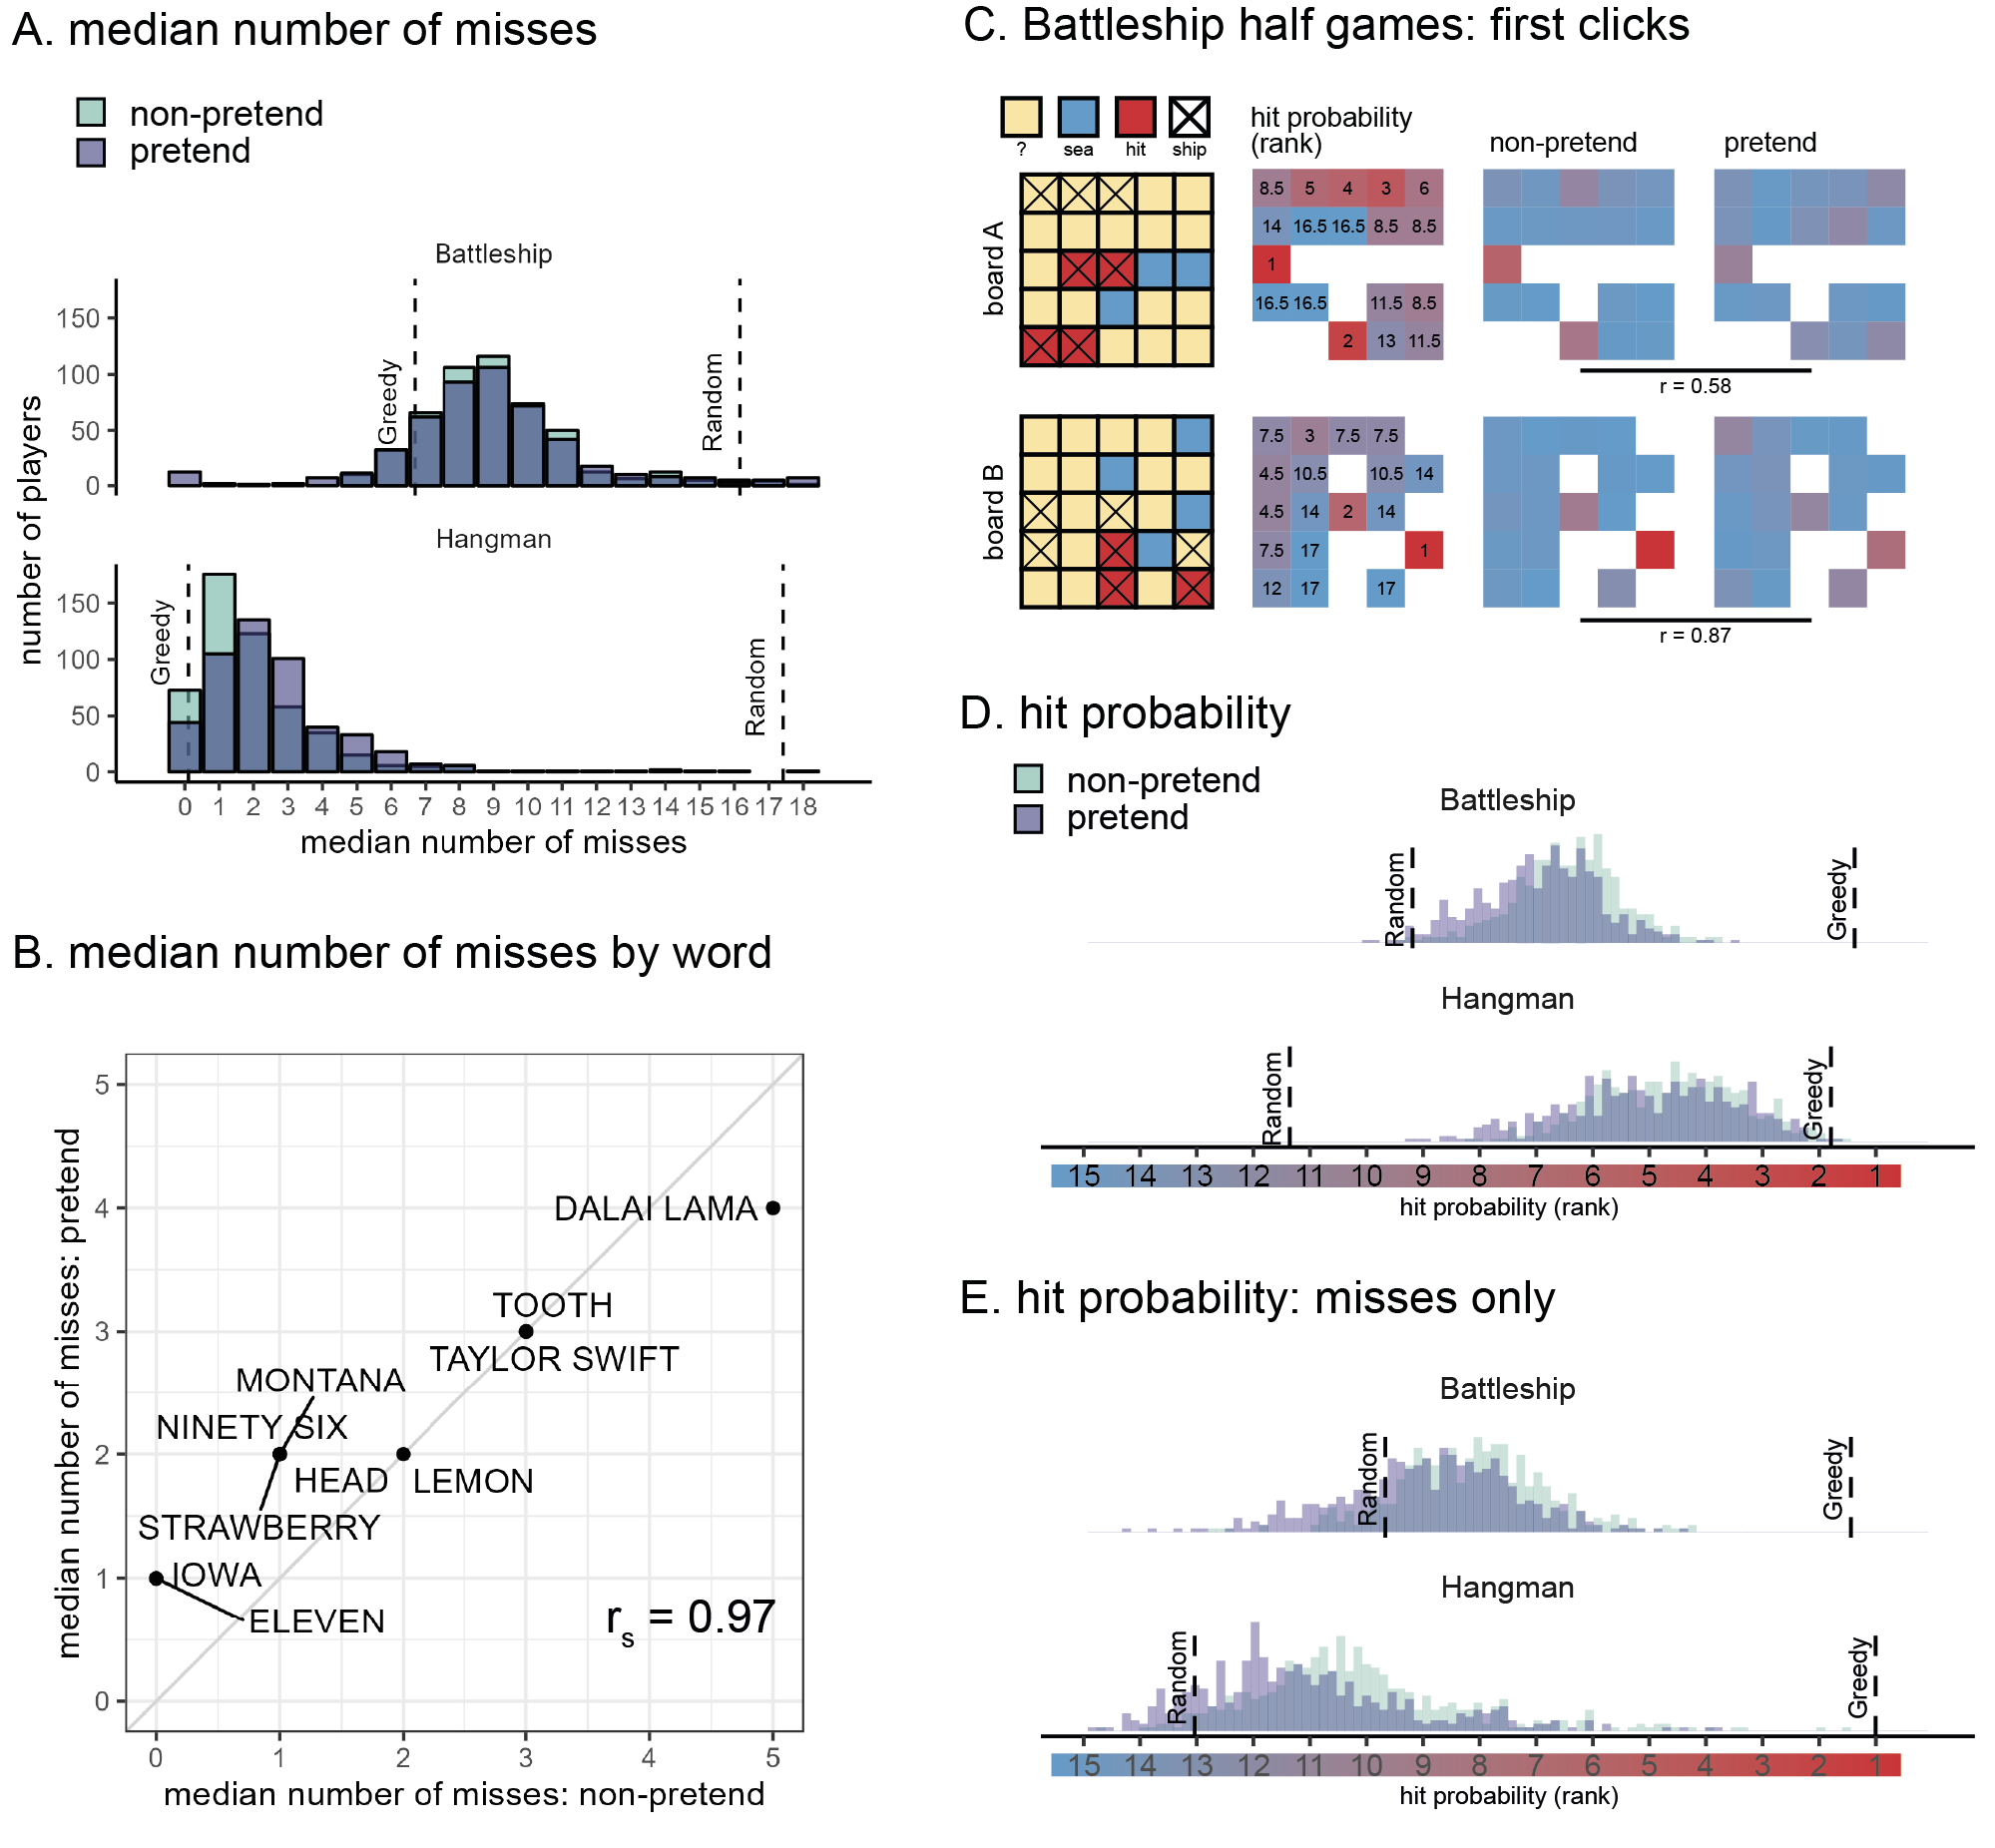
Figure 4.1: Battleship and Hangman guesses in pretend and non-pretend games. A: median number of misses in Battleship and Hangman games, in non-pretend (green) and pretend (purple) games. For reference, the expected number of misses is indicated by a reference line for a fully random agent, and for a “greedy” agent that maximizes the probability of a hit in each step. B: The median number of misses in Hangman for pretend and non-pretend games, as a function of the target word. C: Spatial guess distributions for pretend and non-pretend half-games (where players continued the game from a half-finished state) alongside their corresponding hit probability maps. D: Cell and letter selections were ranked according to their relative hit probability given the players’ knowledge at the time of making the decision (dynamically updated after each guess). Plotting the median rank per subject in pretend and non-pretend games, with reference lines for the expected rank probability for a random agent, and for a “greedy” agent that maximizes the probability of a hit in each step. Note that the expected rank for a greedy agent is greater than 1 because there was not always a single optimal choice. E: same as panel D but discarding all guesses that resulted in a hit.
Having established an alignment in the total number of guesses, we next turned to the content of pretend and non-pretend guesses. In order to directly compare pretend and non-pretend guesses for the same board state, Battleship players completed two half-games in which they were instructed to continue the game from a half-completed state. In standard games, players start in the same (blank) board state but quickly diverge as they make different guess sequences. Including half games allowed us access to hundreds of cell selections for the same board state from pretenders and non-pretenders. This way, we had sufficient statistical power to compare the two guess distributions. We find a strong correlation between the spatial distributions of pretend and non-pretend guesses (board A: \(r=\) .58, \(p\) = .012; board B: \(r=\) .87, \(p\) < .001; Fig. 4.1C), confirming that pretenders were sensitive not only to the number of guesses they would have made had they been playing for real, but also to their content.
To further examine the decisional processes behind this strong alignment, we compared the degree to which pretend and non-pretend guesses made sense within the context of the game. When playing Battleship and Hangman, it makes sense to guess cells or letters for which the probability of hitting a ship or revealing a letter is high (this “greedy” behavior is not strictly optimal, but approximates optimal behavior in most cases, Audinot, Bonnet, and Viennot 2014). To this end, we ranked cells based on the Bayesian probability of a hit given players’ knowledge at the time of making the decision. Critically, hit probability maps were dynamically updated after each guess. In Battleship, this model assumed that all legal board configurations are equally likely a priori, but board configurations were ruled out as the game progressed and the content of individual cells was revealed. In Hangman, we used the category information (e.g., ‘a fruit’), to obtain a probability-weighted list of category-compatible words (or names, in the case of famous people). We relied on prototypicality norms (Uyeda and Mandler 1980) for words, and number of visits to Wikipedia entries for famous people. The full prior distributions for each category were included in the pre-registration (for details, see Supplementary Materials). Similar to Battleship, in deriving hit probability we assume access to the full list of options that is consistent with the game state (the number of hidden letters, the revealed letters and their positions, and the list of letters that do not appear in the game solution) at the time of making the decision.
In the non-pretend versions of both games, guesses were more rational according to this measure than expected by chance (Battleship: \(t(479) = 49.18\), \(p < .001\), Cohen’s \(d\) = 2.24; Hangman: \(t(500) = 86.88\), \(p < .001\), Cohen’s \(d\) = 3.88). Pretend guesses were also more rational than expected by chance (Battleship: \(t(479) = 38.51\), \(p < .001\), Cohen’s \(d\) = 1.76; Hangman: \(t(500) = 72.29\), \(p < .001\), Cohen’s \(d\) = 3.23), but significantly less rational than non-pretend guesses (Battleship: \(t(479) = 11.04\), \(p < .001\), Cohen’s \(d\) = 0.50; Hangman: \(t(500) = -4.57\), \(p < .001\), Cohen’s \(d\) = 0.20 Fig. 4.1D). Critically, pretend guesses were more rational than random guesses even when restricting the analysis to unsuccessful guesses (Battleship: \(t(479) = 10.25\), \(p < .001\), Cohen’s \(d\) = 0.47; Hangman: \(t(487) = 18.91\), \(p < .001\), Cohen’s \(d\) = 0.86; Fig. 4.1E): that is, even when incorrectly guessing a ship’s location or a letter’s identity, pretend guesses made sense given the limited information players pretended to have.
A specific example of this effect in the game of Battleship can be observed in players’ behaviour immediately after hitting the last cell of a size-2 patrol boat (players attempted to reveal two size-2 patrol boats and one size-3 submarine). Among non-pretenders, the next cell selection was often directed at checking whether the two cells were part of the size-3 submarine, but this was only true if the size-3 submarine had not been sunk yet (52% of all cell selections), and not when it had been sunk (4% of all cell selections, and significantly lower than 52%: \(t(395) = 30.47\), \(p < .001\), Cohen’s \(d\) = 1.53). Despite knowing with full certainty that the size-2 patrol boat was not a size-3 submarine, pretenders showed the same qualitative pattern: pretending to check if the revealed cells were part of a size-3 submarine only when they pretended not to know that it was fully sunk (22% of all cell selections), but not when the size-3 submarine had been sunk (4% of all cell selections, \(t(366) = 12.09\), \(p < .001\), Cohen’s \(d\) = 0.63). The tendency to check if the two cells were part of a bigger ship was weaker among pretenders (\(t(467) = -18.07\), \(p < .001\), Cohen’s \(d\) = 0.84).
Good pretense is a function not only of the number and content of players’ decisions, but also of their timing. Here too, pretend games showed the same qualitative patterns as non-pretend games. Like non-pretenders, pretenders were faster in their successful guesses (difference in decision time between hits and misses in Battleship: \(\Delta_{non-pretend}=\) -109 ms, \(\Delta_{pretend}=\) -293 ms; Hangman: \(\Delta_{non-pretend}=\) -386 ms, \(\Delta_{pretend}=\) -297 ms) and slowed down immediately after a hit (difference in decision time between guesses that followed hits versus misses in Battleship: \(\Delta_{non-pretend}=\) 182 ms, \(\Delta_{pretend}=\) 236 ms; Hangman: \(\Delta_{non-pretend}=\) 986 ms, \(\Delta_{pretend}=\) 667 ms; Fig. 4.2A). All effects are significant at the \(0.001\) level with the pre-registered within-subject t-test, except for the post-hit slowing down in Battleship, which, due to outliers with extreme effects in the opposite direction (>10 s), was only significant in a non-parametric Wilcoxon sign-rank test (\(V = 87,876.50\), \(p < .001\)). Effects remain significant at the \(0.001\) level when statistically controlling for the serial position of guesses within the game.
We also examined the effect of decision uncertainty, quantified as the Shannon entropy of the posterior distribution over cell or letter options, on decision times. To this end we fitted subject-level linear models, predicting reaction times from the linear and quadratic expansions of decision entropy, and contrasted the coefficients against zero in a group-level t-test. In the non-pretend versions of the games, the quadratic coefficients were significantly negative, with the slowest responses associated with mid-range levels of entropy (see Fig. 4.2B; Battleship: \(t(479) = -4.20\), \(p < .001\), Cohen’s \(d\) = 0.19; Hangman: \(t(500) = -8.70\), \(p < .001\), Cohen’s \(d\) = 0.39. When restricting the analysis to those Battleship players who pretended after playing normally, this effect was significant only in a Wilcoxon rank-sum test, due to outliers in the sample: \(V = 3,892.00\), \(p < .001\)). Critically, the quadratic coefficients were significantly negative also in pretend games (see Fig. 4.2B; Battleship: \(t(479) = -15.65\), \(p < .001\), Cohen’s \(d\) = 0.71; Hangman: \(t(500) = -3.49\), \(p = .001\), Cohen’s \(d\) = 0.16). In other words, despite knowing the game’s solution with full certainty, pretenders successfully feigned subtle qualitative effects of counterfactual uncertainty on their decision times.

Figure 4.2: Patterns of decision time in pretend and non-pretend games. A: median decision times for hits and misses, as well as the decisions following them. In both Battleship and Hangman, hits were faster on average than misses, but guesses following a hit were slower on average than those following a miss. This pattern was mimicked in pretend games. B: median decision times as a function of decision uncertainty, quantified as the entropy of the posterior over guess options. In both Hangman and Battleship, guesses were slowest for mid-range levels of entropy, and this pattern was mimicked in pretend games. Shaded areas represent the bootstrapped standard error of the median.
4.2 Stereotypical, imperfect self-simulation
Though impressive, the capacity for simulating a state of ignorance was not perfect. Importantly, the limitations and biases we observe are consistent with the simulation of a stereotypical, “cartoon” model of decision-making, rather than leakage of concealed information into the decision-making process as would be expected if pretenders’ success was due to efficient, but imperfect, suppression of their knowledge of the game solution. First, despite showing the same qualitative effects, decision time patterns in Battleship pretend games (but not Hangman pretend games) were systematically more pronounced relative to non-pretend games: a form of “over-acting”. Specifically, the difference in reaction times as a function of guess outcome (Fig.3A) was larger in pretend games, both when measured with respect to the current guess (\(t(479) = 10.69\), \(p < .001\), Cohen’s \(d\) = 0.49), and with respect to the following guess (\(t(479) = 2.69\), \(p = .007\), Cohen’s \(d\) = 0.12). Similarly, the quadratic effect of decision entropy on decision times was stronger in pretend games (\(t(479) = 4.92\), \(p < .001\), Cohen’s \(d\) = 0.22).
Furthermore, pretend games followed stereotypical patterns, and as a result were more homogeneous than non-pretend games. Despite a highly similar average number of misses in pretend and non-pretend games (Fig. 4.1A), the number of unsuccessful guesses was overwhelmingly less variable in pretend relative to non-pretend games (Battleship: sd=1.61 in pretend versus 2.60 in non-pretend games, \(t(499) = -15.65\), \(p < .001\), Cohen’s \(d\) = 0.70; Hangman: sd=1.53 in pretend versus 2.65 in non-pretend games, \(t(500) = -12.65\), \(p < .001\), Cohen’s \(d\) = 0.56; Fig. 4.3A). Moreover, while pretenders produced more letter misses for harder words (Fig. 2B), they underestimated the difficulty of the very hard “DALAI LAMA” and overestimated the difficulty of the easy number (“ELEVEN” and “NINETY SIX”) and state (“MONTANA” and “IOWA”) words. That is, pretenders consistently enacted what they saw as a ‘typical’ or a ‘representative’ game, one that is not unusual in the number of lucky or unlucky guesses. This is again consistent with shrinkage toward the mean of a generative self-model (Mazor and Fleming 2021; Jansen, Rafferty, and Griffiths 2021), with an attempt to avoid extreme outcomes to appear convincing to a hypothetical observer (Oey, Schachner, and Vul 2023), and with representativeness skewing intuitions about randomness (Kahneman and Tversky 1972).
Next, we examined variability not in the number of guesses, but in their contents. We separately computed the Shannon entropy of the guess distribution across different games for each player, condition (pretend or non-pretend), and serial guess number. High entropy then corresponds to pronounced variability in the guess sequences of different games, and low entropy to a tendency to repeat the same sequence of guesses in different games. For example, if a player always starts their games by clicking in the top left corner, their guess entropy for the first click will be H([1,1,1,1,1])=0. Unsurprisingly, the within-participant sequential guess entropy increased as a function of guess number, consistent with players adjusting their behaviour in light of the outcomes of previous guesses, making individual games increasingly more varied (Fig. 4.3B). If pretend games were a similar but noisier version of standard games, their associated guess entropy would be higher, reflecting the additional noise in the decision-making process, or the game-specific biases that are associated with the suppression of specific words or game states. Critically, however, entropy was systematically reduced in pretend games (p<0.001 for a within-subject t-test of guess entropy in guesses number 1-4 in both Battleship and Hangman, see Supplementary Materials for guess-specific statistics). Thus, when pretending, participants produced similar guess sequences across different games. In Hangman, for example, this meant that non-pretenders more flexibly adjusted their first letter guess to the word category and number of letters, compared to pretenders, who tended to open the game with the same letter guess irrespective of the specific game state. This seems consistent with an attempt to enact what they saw as typical, representative, or average behaviour. In contrast, a reduction in the guess sequence entropy is inconsistent with leakage of suppressed knowledge into the decision-making process, as would be expected if differences between pretend and non-pretend games reflected the imperfect suppression of the game’s solution.
One possible account of the reduced decision entropy in pretend games is that it reflects pretenders’ miscalibrated intuitions about randomness, conforming to a prototype of randomness that is itself too ordered. If the same prototype of randomness is used by pretenders to determine the number of unsuccessful guesses per game, the two measures should be correlated across participants. Crucially, we find the exact opposite pattern: a negative correlation between variability in the number of unsuccessful guesses and game entropy (Battleship: \(r_{\mathrm{s}} = -.20\), \(p\) < .001, Hangman: \(r_{\mathrm{s}} = -.12\), \(p\) = .009). This negative correlation was not observed in non-pretend games (and was even positive for Battleship: \(r_{\mathrm{s}} = .11\), \(p\) = .018; Hangman: \(r_{\mathrm{s}} = -.01\), \(p\) = .018). We interpret this as evidence that the reduction in variance reflects miscalibrated beliefs not only about randomness, but also about participants’ behaviour under a counterfactual knowledge state. Those players who thought they would strictly follow a particular sequence of guesses (low entropy), ended up producing games of more variable lengths, as their success depended more on luck. Other players adjusted their decision strategy more flexibly, perhaps attempting to produce games that are not too long or short, in line with their intuitions about randomness.
Finally, Hangman pretenders were more likely to guess letters that appear frequently in English words (E, T, A, etc.) irrespective of the game state, compared to genuine players (Fig. 4.3C). This suggests that in their attempt to behave as if they didn’t know the true state of the game, pretenders had an increased tendency to follow rigid heuristics and rules, ignoring useful information as a result (but see Supplementary Materials for evidence that heuristic use alone cannot fully explain pretenders’ behaviour).
This limitation on incorporating evidence into the (simulated) decision-making process was especially evident in Hangman half-games, where players completed the game from a half-completed state. When asked to reveal the hidden fruit “_A_A_A”, 90% of the non-pretenders guessed one of the letters ‘B’ or ‘N’ (Fig. 4.3D, yellow bars in left column). Among pretenders who knew that the hidden word was BANANA, this preference was reduced to 78% (this drop was significant in a binomial test: \(p=\).002). Importantly, half of the pretenders were given different information: they were told that the hidden word was the less prototypical fruit PAPAYA. Although good pretenders should simulate their behavior had they not known this information, only 29% selected the letters ‘B’ or ‘N’, with many guessing letters that are not consistent with either PAPAYA or BANANA (gray bars in Fig. 4D), revealing that many pretenders had the knowledge that PAPAYA would be a hard fruit to guess, therefore avoiding the letter ‘P’, but were still unable to predict that BANANA would have immediately come to their minds (Fig. 4.3D, yellow bars in right column). A similar pattern was observed for the prototypical body part word HA(ND) and its surprising counterpart HA(IR): when playing normally, 75% of the players selected letters that are consistent with the prototypical option HAND. This figure was 79% among pretenders for whom the target word was HAND, in contrast to only 39% among pretenders for whom the target word was HAIR (Fig. 4.3D, blue bars).
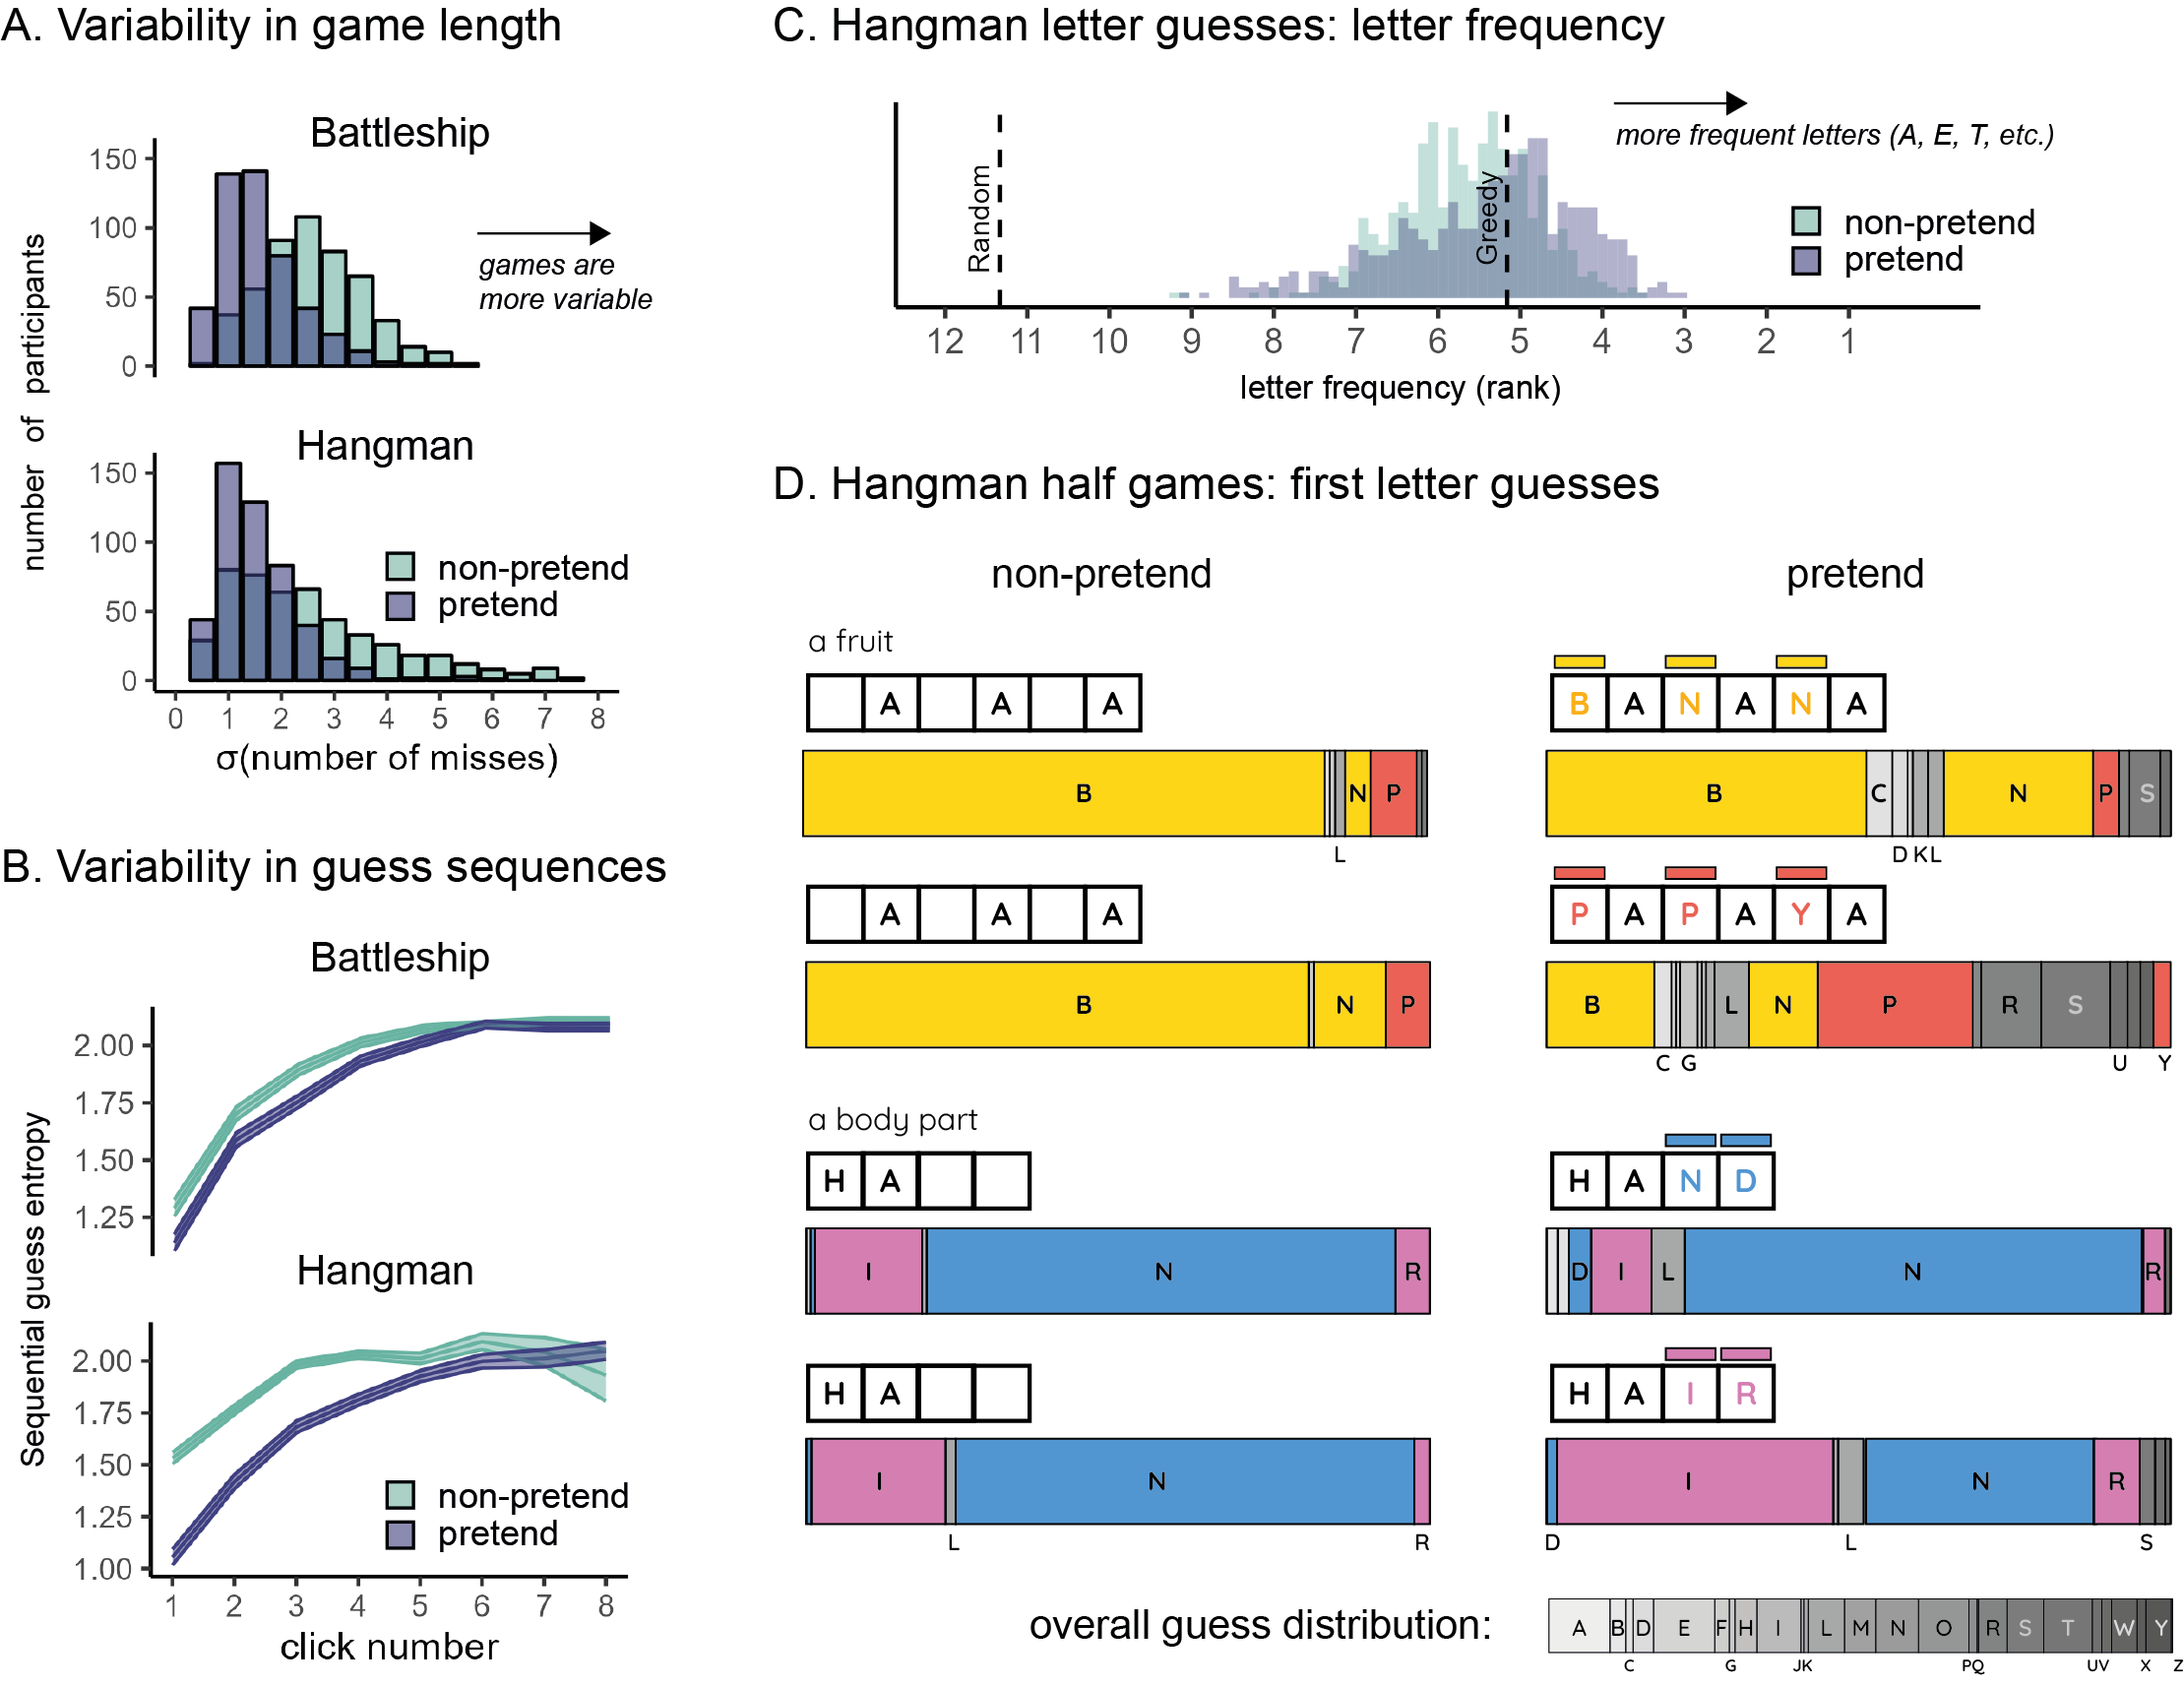
Figure 4.3: Limitations on flexible decision-making when pretending. A: variability in the number of misses (extracted individually for each player and then averaged) was lower in pretend games. B: sequential guess entropy, a measure of the (inverse) predictability of individual players’ guesses as a function of click number and guess number. In both Battleship and Hangman, sequential guess entropy increased with click number, and was overall lower in pretend games. Shaded areas represent the mean +- one standard error. C: letter frequency of Hangman guesses: the median rank frequency per participant in pretend and non-pretend games, with reference lines for the expected rank frequency for a random agent, and for a “greedy” agent that maximizes the probability of a hit in each step. D: first letter guesses in Hangman half-games, as a function of pretense condition and target word. Letters appear in alphabetical order. letters that appear in the target word are marked in yellow (BANANA), red (PAPAYA), blue (HAND) and magenta (HAIR). For reference, the overall distribution of letter guesses across all games and conditions is given below.
4.3 Failure to detect pretending
These systematic deviations of pretend games from behaviour under true ignorance made pretend games discernible from non-pretend games. To illustrate, a support vector machine (SVM) algorithm reached an accuracy level of 72% (Battleship, 2AFC) and 60% (Hangman, yes/no) in linearly classifying condition (pretend / non-pretend) based on just three basic summary features: median decision latency, game optimality score, and number of irrational guesses per game. Despite this, human observers were entirely fooled by players’ pretending. After performing pretend and non-pretend games, participants were presented with game replays of previous players and took on the new role of being a ‘judge’ who had to determine who was pretending and who was playing for real. In Battleship, judges were presented with five pairs of game replays from different players. Within each pair, one player was a pretender, and judges’ task was to identify the pretender (or, for a random half of the judges, identify the real player). In Hangman, judges were presented with five game replays, each from a different player attempting to reveal a different word. For each individual game replay, the probability of it being a pretend game was 0.5, such that the number of pretend game replays was anywhere between 0 and 5 following a binomial distribution. Judges’ task was to decide, for each game, whether it was played as a pretend or a non-pretend game. In both games, pretense detection was at chance (Battleship: 51%, \(t(499) = 1.45\), \(p = .147\); Hangman: 51%, \(t(452) = 0.57\), \(p = .568\)). This is in line with previous findings of near-chance accuracy in lie detection (Bond and DePaulo 2006). Moreover, we find no sign of a correlation between pretense quality (measured as players’ ability to trick judges into thinking they were not pretending) and pretense detection ability (measured as proportion correct; Battleship: \(r_{\mathrm{s}} = -.05\), Hangman: \(r_{\mathrm{s}} = .00\)), indicating that pretense and pretense detection rely on at least partly different cognitive processes.