2 Exp. 2: Hangman
2.1 Methods
We report how we determined our sample size, all data exclusions (if any), all manipulations, and all measures in the study.
A detailed pre-registration can be accessed at osf.io/3thry. The pre-registration was time-locked using cryptographic randomization-based time-locking (Mazor, Mazor, and Mukamel 2019). Due to an error in the experiment code, time-locking took effect only from player number 221 (batch 3) and on (protocol sum: c4929c7fe33df1b7b52f15c789d98eab30a9cee09a8121807a3c59e28e7430a4; relevant lines in experimental code).
2.1.1 Participants
The research complied with all relevant ethical regulations and was approved by the Research Ethics Committee of Johns Hopkins University. 501 Participants were recruited via Prolific (prolific.co) and gave their informed consent prior to their participation. They were selected based on their acceptance rate (>95%) and for being native English speakers. The entire experiment took approximately 20 minutes to complete. Participants’ pay was equivalent to an hourly wage of 9.50 USD, in addition to a bonus payment of 1 USD that was awarded to 236 players who earned 100 points or more.
2.1.2 Procedure
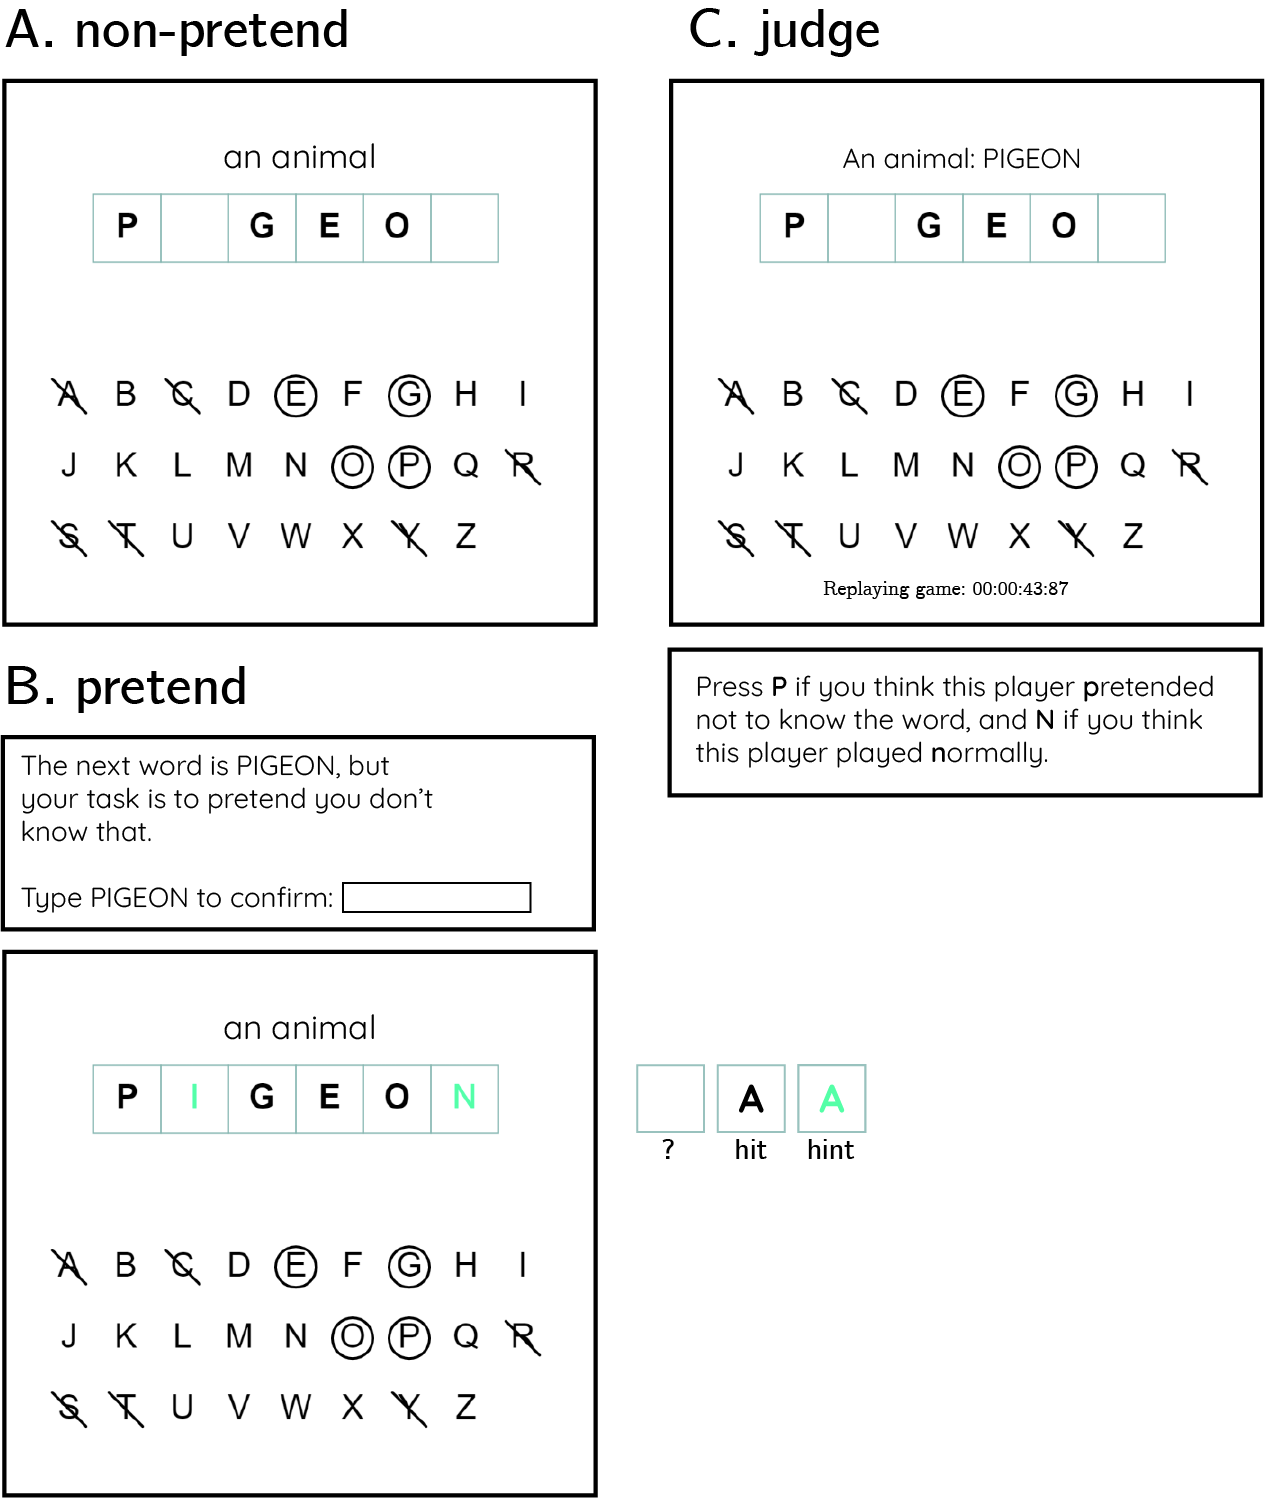
Figure 2.1: Experimental Design: players will play 12 games of the game Hangman in two conditions presented in two blocks of 6 games. The order of blocks will be randomized between players. A: In non-pretend games, players will start the game not knowing the identity of the hidden word, and try to reveal the word with as few letter guesses as possible. B: In pretend games, players will be told the identity of the word, and their task will be to play the game as if they do not have this information. Before pretending, players will verify they had read the hidden word by typing it. C: Lastly, in 5 judge trials players will observe a replay of the game of a previous player, and try to tell whether the player was pretending or not.
The first instructions screen informed participants that the experiment, based on the game Hangman, had three parts, and that the points they accumulate translate to a monetary bonus payment. They were then be presented with a leaderboard of previous players. Then, the rules of the game were presented:
In the following game, your task is to reveal a hidden word or phrase by guessing letters. What makes the game difficult is that you can’t see the word; all you can see is a row of squares - a square for each letter. Use your mouse to make letter guesses. We will have five types of words: body parts, numbers, US states, fruit, and famous people. You will start each game with 15 points and lose one point for every guess of a letter that is not in the word.
We then explained that “the words in this game are the kind of words that will be familiar to most English-speaking fifth-graders. We didn’t pick any strange or particularly difficult words”.
Once they responded correctly to a multi-choice comprehension question (“the goal of the game is to…”: “reveal the word with as few letter guesses as possible”), participants played a practice round, revealing the word PIGEON (see Fig. 2.1A).
After the main instructions, comprehension question and practice round, participants completed one pretend and one non-pretend block, each followed by one half-game (see below for details). The order of pretend and non-pretend blocks was counterbalanced between participants. Each block comprised five games played with five out of ten different words, and one half-game. The allocation of words to conditions was randomized between participants, with the constraint that both pretend and non-pretend blocks included exactly one word from each category. The order of words within a block was randomized, except for the half-game, which was always delivered at the end.
The ten words included two number words (ELEVEN, NINETY SIX), two famous people (DALAI LAMA, TAYLOR SWIFT), two fruits (STRAWBERRY, LEMON), two body parts (TOOTH, HEAD), and two US states (MONTANA, IOWA).
2.1.3 Non-pretend games
In non-pretend games, participants revealed a hidden word with as few letter guesses as possible. An online counter of the number of points was displayed on the screen, deducting one point for every guess of a letter that is not in the target word. After each game, feedback was given about the number of points obtained.
After completing the five games, participants performed one half-game (see below for details).
2.1.4 Pretend games
Participants were given the following instructions:
In the next part of the experiment, you’ll play 6 games where you reveal a hidden word by guessing letters.
However, this time your goal is different.
In this round, we’re going to tell you the word in advance, but we want you to act like you don’t know this information.
To see how good you are at this, we’re going to compare your games to the games of people who played normally, without knowing what the word was, and see how similar they are. We will measure which letters you click and the timing of your guesses; if your clicks look similar to people who played like normal (trying to reveal the word with as few guesses as possible, but without any hints), you’ll get bonus points. But if your games look different, you won’t get these bonus points. Your number of clicks in this part will not affect your bonus. Only your ability to play like you didn’t see the word in advance.
After one practice round, pretending not to know that the hidden word is PIGEON, and one comprehension question (“In this part of the experiment my goal is to…”: “play the game as if I don’t know what the word is so that I look like someone who had no hints”), participants played five pretend games. Each game was preceded by a short message informing subjects about the identity of the target word. To start pretending, players were asked to type in the target word on their keyboard. After pretending, we reminded players that a game that looks similar to the games of participants who had no hints will be awarded 10 bonus points.
After completing the five games, participants performed one half-game (see below for details).
2.1.5 Half games
In order to directly compare participants’ pretend and non-pretend games for identical belief states (true or pretended knowledge about the identity of the word), we asked participants to also complete one pretend and one non-pretend game, given a partly finished game with some letters already guessed (they were told that the computer made these guesses). The two half-game words were one fruit: PAPAYA or BANANA, with guessed letters [A, E, I, O, M, T], and one body part: HAND, or HAIR with guessed letters (A, E, O, M, T, H, P). The assignment of category (fruit or body part) to condition (pretend and non-pretend), as well as the identity of the target word within each category (e.g., PAPAYA or BANANA), was randomized between participants.
Instructions for the non-pretend half-game were:
For the next game, the computer chose the first letters for you; you can take over from where it left off. Your challenge is to complete the game. Just like in the previous games, here also you will lose one point for each letter that you guess and is not in the word.
Instructions for the pretend half-game were:
For the next game, the computer chose the first letters for you; you can take over from where it left off. Just like in the previous games, here also you will know what the word is, but your bonus points will depend on your ability to play as if you didn’t know the word.
2.1.6 Judge trials
In the final part of the experiment, participants observed five games of previous players and determined who had hints and who didn’t. Instructions for this part were:
In this third and last part of the experiment, we ask you to be a judge for previous players, and see if you can tell which of the players were shown the word (but acted like they weren’t). We will show you 5 replays of the games of previous players. Your task is to decide whether they played normally or pretended. For each game that you get right, you will receive 10 points. Good luck!
Then, on each judge trial, one game of a previous player was replayed in real time, with the target word presented above. For non-pretend games, only games from the group of participants that pretended in the second block (and played normally in the first block) were chosen for presentation in this part. For both pretend and non-pretend games, only games shorter than 1.5 minutes were presented. Judge participants indicated their decision by pressing the P and N keys on their keyboard. After making a decision, participants were informed whether they received the 10 points. Whenever a pretend game was classified as a non-pretend game, they were informed that the pretender received these 10 points instead of them.
Lastly, participants were asked the following debrief questions:
Did you have a strategy that you used for pretending you did not see the word? What was most difficult about pretending? How about telling between players who pretenders and who played for real - did you have a strategy for that?
And:
We would appreciate it if you could share any thoughts you had about the experiment, or anything we should take into account when analyzing your data.
2.2 Results
2.2.1 Hypothesis 1 (Game duration)
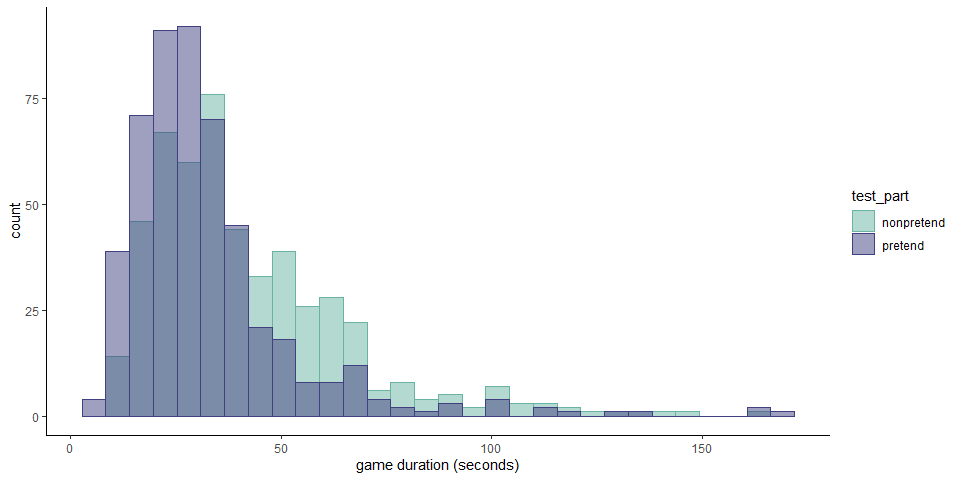
The median game duration in non-pretend games was 36 seconds in non-pretend games and 28 seconds in pretend games. Pretend games were significantly shorter among subjects that pretended in the first block (\(t(232) = -3.67\), \(p < .001\)) and in the second block (\(t(267) = -7.82\), \(p < .001\)).
2.2.2 Hypothesis 2 (first click latency)
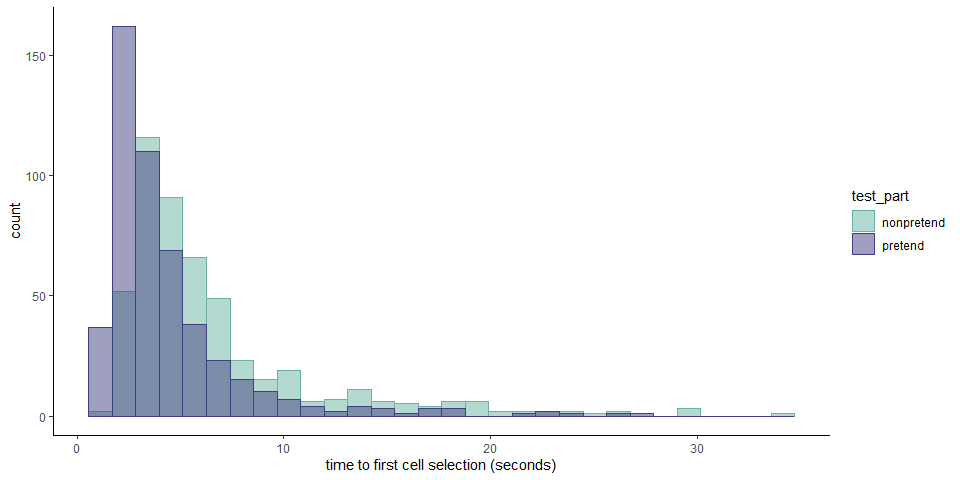
The median time taken to make the first letter selection was 3.32 seconds in pretend games and 4.98 in non-pretend games. First letter selections were slower in non-pretend games in both groups (pretend-first group: \(t(232) = 17.93\), \(p < .001\); pretend-second group: \(t(267) = 20.02\), \(p < .001\)).
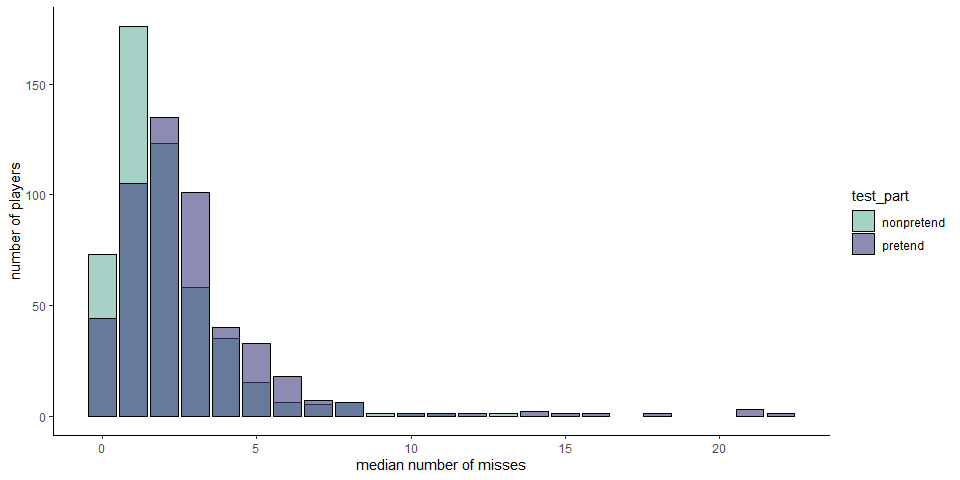
2.2.3 Hypothesis 3 (number of misses)
The mean number of misses was 1.9421158 in non-pretend games and 2.8003992 in pretend games. The difference between the two was significant among players that pretended in the first part (\(t(232) = -5.96\), \(p < .001\)), and among those that pretended in the second part (\(t(267) = -3.26\), \(p = .001\)).
2.2.4 Hypothesis 4 (click latency by outcome)
In non-pretend games, cell selections that resulted in a hit were faster by 386 ms than those that resulted in a miss (pretend-first group: \(t(227) = -4.62\), \(p < .001\); pretend-second group: \(t(265) = -4.28\), \(p < .001\)).
In pretend games, cell selections that resulted in a hit were faster by 297 ms than those that resulted in a miss (pretend-first group: \(t(228) = -3.36\), \(p = .001\); pretend-second group: \(t(252) = -2.42\), \(p = .016\)). The effect of hitting versus missing a ship was marginally weaker in pretend games in the group that pretended first(\(t(223) = 1.98\), \(p = .049\)) but not in the group that played normally first (\(t(250) = 0.24\), \(p = .812\)). Crucially, pretend and nonpretend games were not different according to this measure when focusing on the first block only (\(t(459.12) = 1.59\), \(p = .112\)).
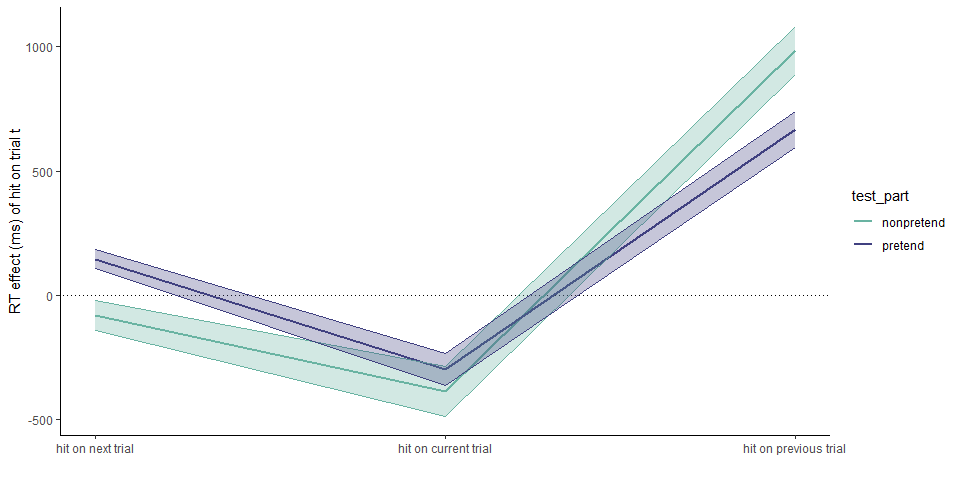
2.2.5 Hypothesis 5 (click latency by previous outcome)
In non-pretend games, cell selections that followed a hit were not faster or slower than those that followed a hit (pretend-first group: \(t(231) = 0.25\), \(p = .803\); pretend-second group: \(t(267) = 0.33\), \(p = .741\)).
In contrast, pretend cell selections that followed in a hit were slower by 667 ms. than those that followed a miss (pretend-first group: \(t(229) = 2.84\), \(p = .005\); pretend-second group: \(t(256) = 3.44\), \(p = .001\)). The effect of following a hit versus a miss was not significantly stronger in pretend games (pretend-first group: \(t(228) = 1.12\), \(p = .264\); pretend-second group: \(t(256) = 0.15\), \(p = .883\)).
2.2.6 Hypothesis 6 (click latency by next outcome)
Letter selections preceding a hit were faster than those preceding a miss in non-pretend games only in the group that pretended first (\(t(219) = -3.40\), \(p = .001\)) but not in the group that played normally first (\(t(257) = -1.86\), \(p = .064\)). This effect was not observed in pretend games (pretend first: \(t(223) = -0.57\), \(p = .567\); non-pretend first: \(t(241) = -1.01\), \(p = .311\)). We find a significant interaction between these effects in the group that pretended first (\(t(210) = 2.75\), \(p = .006\)) but not in the other group (\(t(231) = 1.67\), \(p = .097\)). The difference was not significant when analyzing first blocks only (\(t(260.60) = -1.80\), \(p = .072\)).
2.2.7 Model based analysis
The next analyses were designed to test for differences in game optimality between pretend and non-pretend games, and for a relationship between decision difficulty and click latency. To do so, we approximated optimal behavior by approximating the posterior probability that a letter appears in the word, given available information. Critically, in modelling pretend games we do not treat hints as part of this available information, because an optimal player should ignore this information in choosing where to click next. Given this posterior, a rational player should choose letters that have a high posterior probability of appearing in the word.
To approximate the posterior probability of letters given a game state, we followed the following procedure:
We used the category information (e.g., ‘a fruit’), to obtain a probability-weighted list of category-compatible words (or names, in the case of famous people). The lists were obtained in the following way: for US states and number names, we used an exhaustive list (in the case of numbers, of numbers of 1-2 words), fruit names were taken from Wikipedia (simple.wikipedia.org/wiki/List_of_fruits), famous people names from a crowdsourced document, and body-part words from existing prototypicality norms (Uyeda and Mandler 1980). We extended Uyeda and Mandler’s list of body part words by adding all body part words commonly appearing in lists on the internet. In the case of famous people, names were given prior probabilities in proportion to the number of visits their Wikipedia entries received in 2021. The top 100 most popular entries were given a prior probability twice that of the next 100, three times that of the next 100, and so forth. All entries from 600 and on were given the same prior probability, seven times smaller than that of entries at the top 100 positions. In the cases of fruits and body parts, we used prototypicality norms from Uyeda and Mandler (1980) to assign higher prior probability to more prototypical words (mapped to lower numbers on the 1-7 scale used by Uyeda and Mandler). Words that were not included in the norm were given the maximum score (that is, the lowest perceived prototypicality), of 7. Body parts and fruits were included in both singular and plural forms. The plural forms were assigned a prototypicality score of 100, due to the fact that category names were presented in the singular form (‘a fruit’ and ‘a body part’). We then took the reciprocal for each score, and normalized it by the total sum to get a probability distribution over words \(p(w)\). The full prior distributions for each category are included in this pre-registration.
The likelihood of a game state given a target word \(p(s|w)\) equals 0 when the word is inconsistent with the information available to the player (this includes the word length, the identity of letters that do not appear in the word based on previous guesses, and the identity and position of letters that do appear in the word based on previous guesses). When consistent, the likelihood is a non-zero quantity that is equal for all consistent words. Bayes rule was used to extract the posterior over words given game state \(p(w|s)=\frac{p(s|w)p(w)}{\Sigma_{w'}{p(s|w')p(w')}}\). The full non-zero \(p(w|s)\) distributions for the initial states of all games are included in this pre-registration.
The probability that an individual letter appears in the target word \(p(l|s)\) is the sum of posterior probabilities of words that contain this letter \(p(l|s)=\Sigma_{w}p(w|s)\times includes(w,l)\) where \(includes(w,l)\) returns 1 if \(l\) appears in \(w\) and 0 otherwise.
A posterior probability over letter selections was obtained by dividing the probabilities of individual letters by their total sum \(\frac{p(l|s)}{\Sigma_{l}p(l|s)}\).
To quantify this notion of optimality, before each cell selection we computed the posterior probability that each of the unclicked letters appeared in the target word, given the game state. Then, we ranked letters from highest to lowest according to their posterior probability and recorded the rank of the chosen cell.
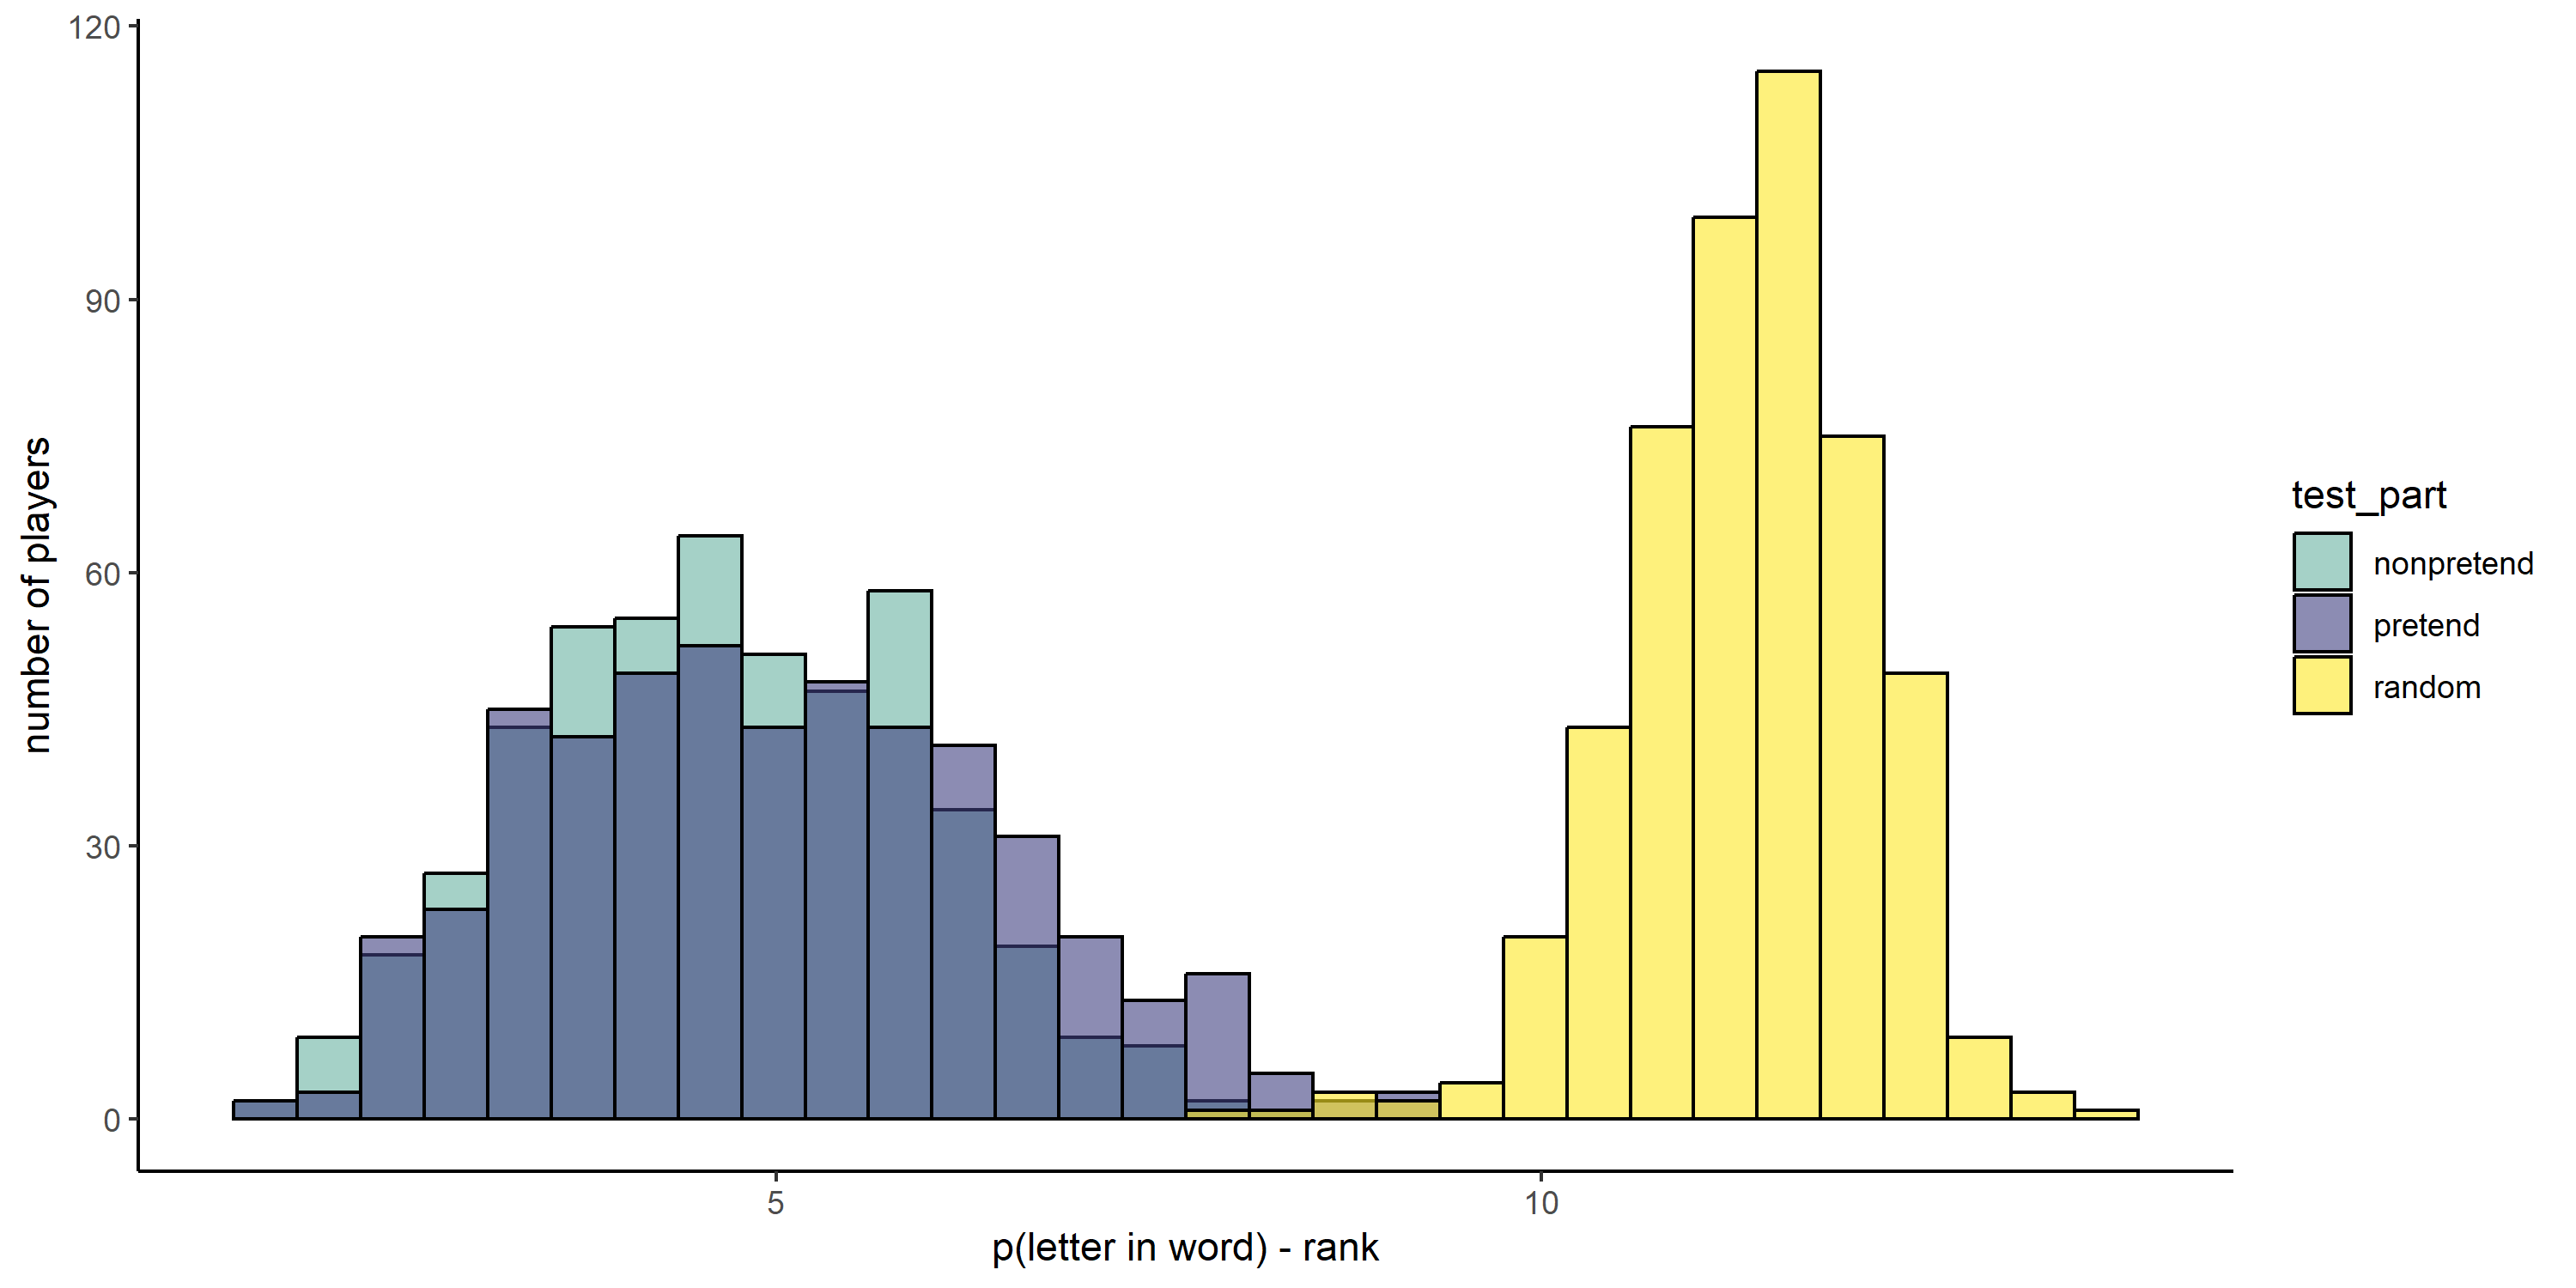
2.2.8 Hypothesis 7 (optimality)
Letter selections in non-pretend games had a higher posterior probability to be included in the word than in random games (pretend first: \(t(232) = -59.66\), \(p < .001\); non-pretend first: \(t(267) = -63.07\), \(p < .001\)). The same was true for letter selections in pretend games (pretend first: \(t(232) = -46.83\), \(p < .001\); non-pretend first: \(t(267) = -55.96\), \(p < .001\)). Non-pretend letter selections had a higher posterior probability than pretend letter selections among players who pretended first (\(t(232) = 5.96\), \(p < .001\)) but not in the group that played normally first (\(t(267) = 0.72\), \(p = .469\)). Comparing data from the first condition only in a between-subject manner revealed a significant difference (\(\Delta M = -0.52\), 95% CI \([-0.77, -0.28]\), \(t(453.21) = -4.25\), \(p < .001\)).
When focusing on misses, non-pretend letter selections were more optimal than random (pretend first: \(t(231) = -20.23\), \(p < .001\); non-pretend first: \(t(267) = -22.41\), \(p < .001\)), as well as pretend games (pretend first: \(t(229) = -13.46\), \(p < .001\); non-pretend first: \(t(257) = -13.37\), \(p < .001\)). In both cases, non-pretend games were more optimal than pretend games (pretend first: \(t(228) = 6.60\), \(p < .001\); non-pretend first: \(t(257) = 5.36\), \(p < .001\))
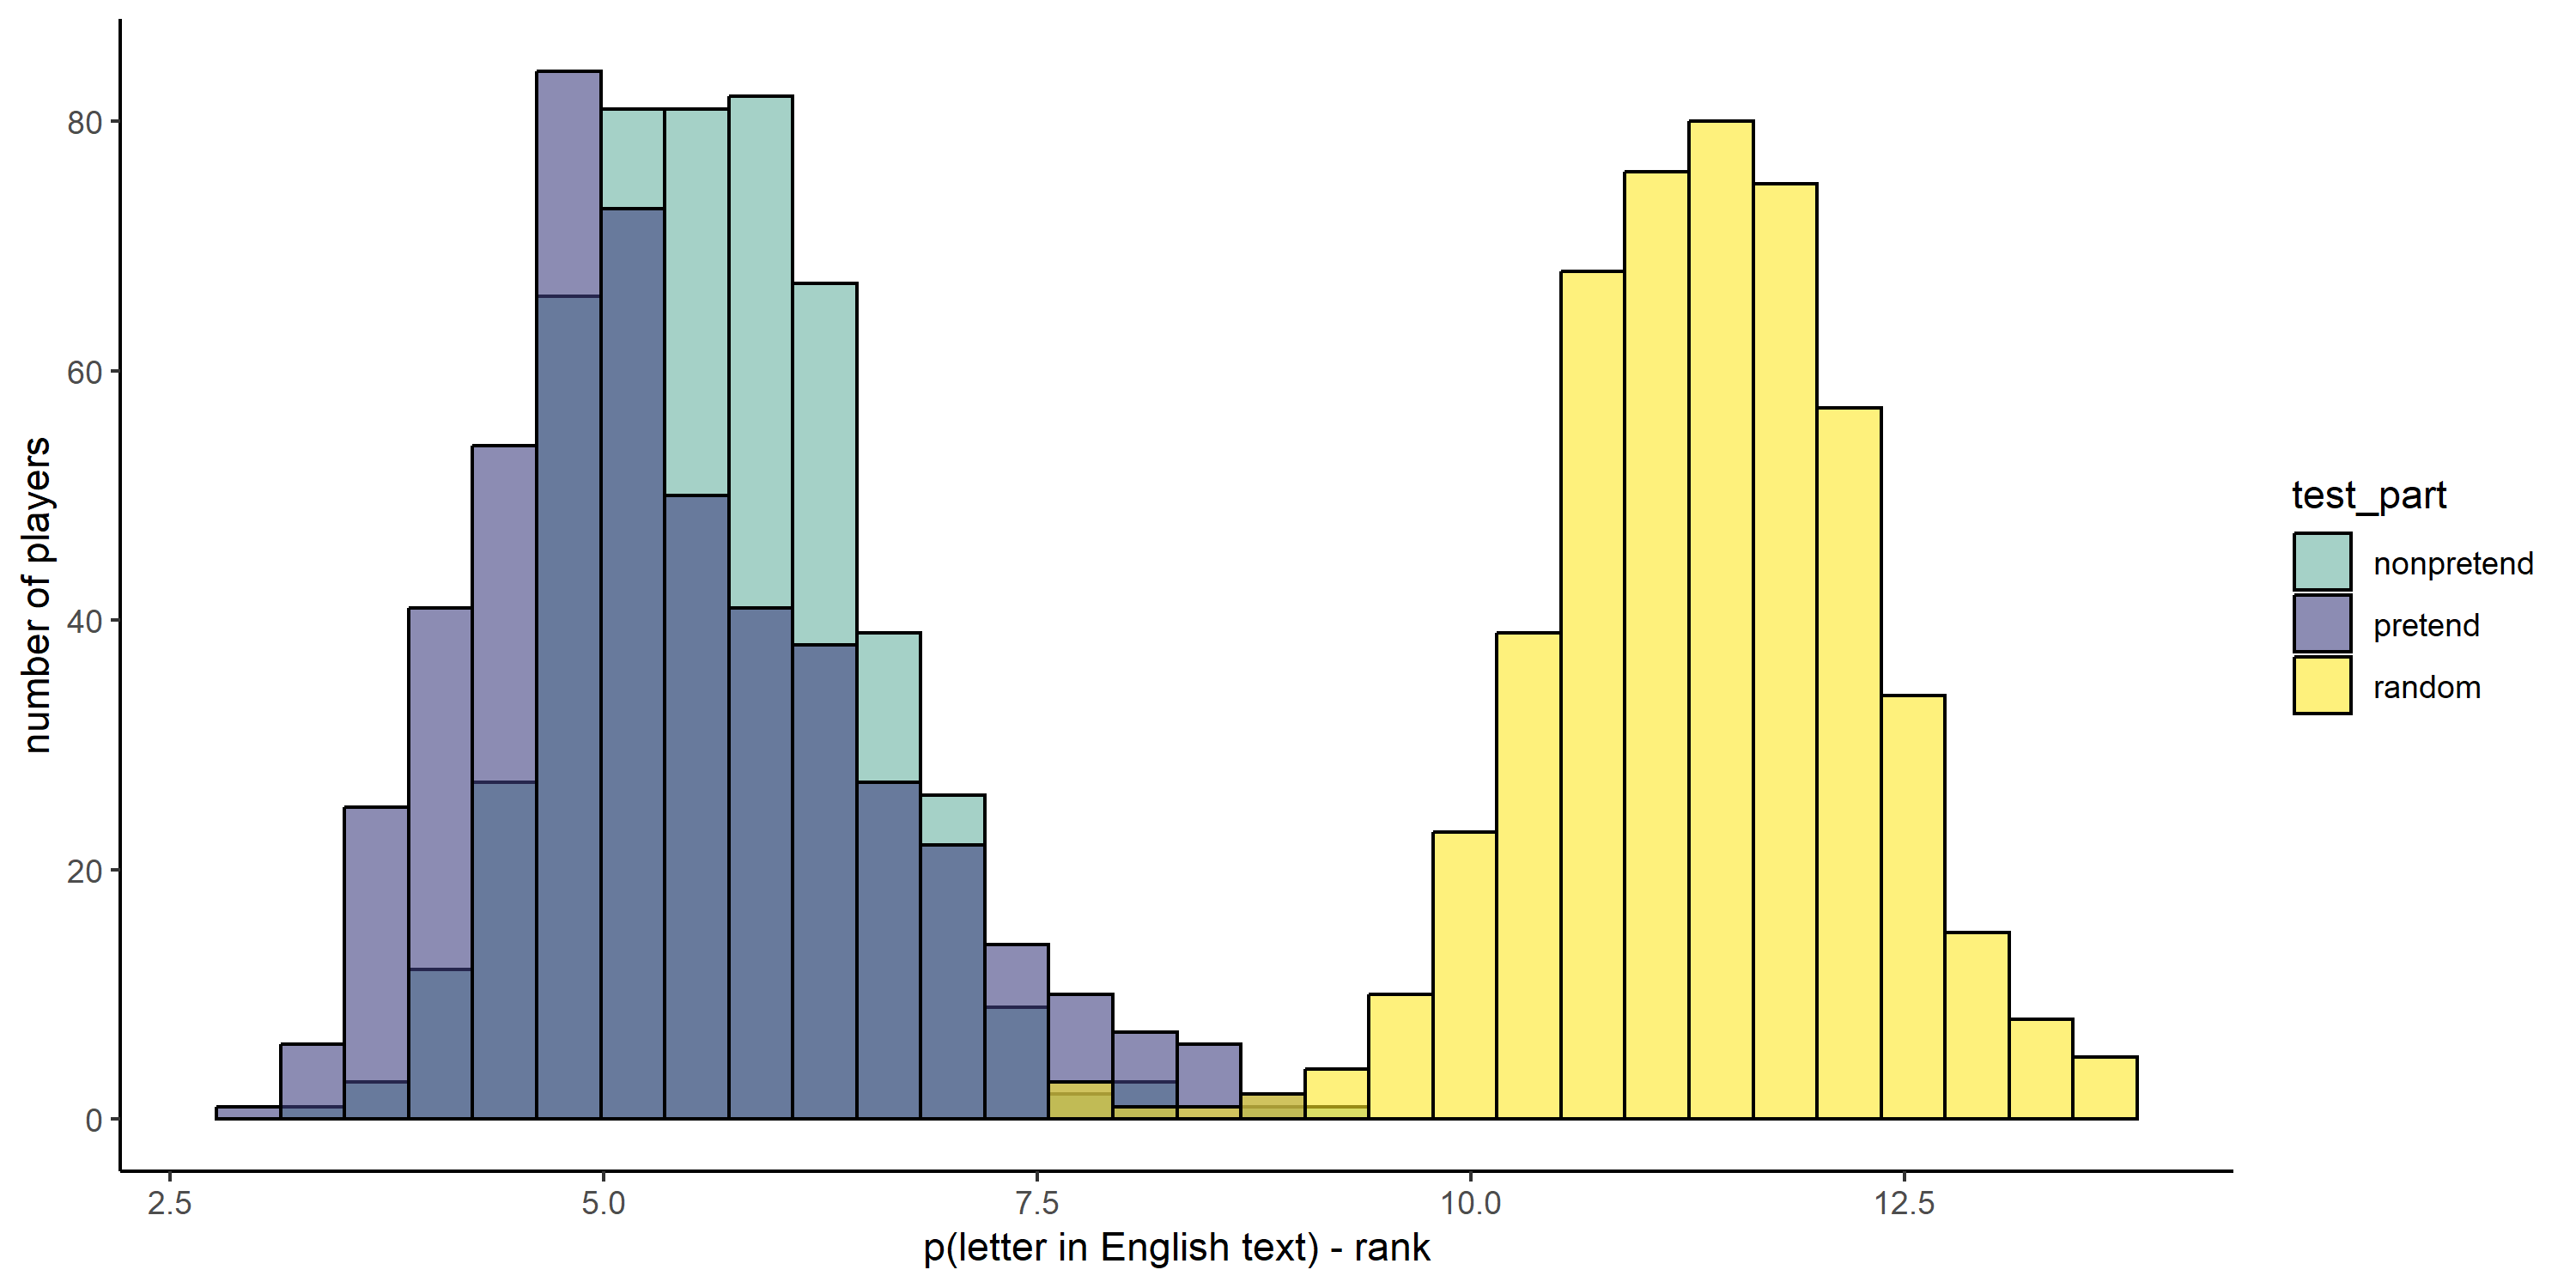
2.2.9 Hypothesis 7b (Letter frequency)
Non-pretenders selected high-frequency letters more than expected by chance (pretend first: \(t(232) = -70.56\), \(p < .001\); non-pretend first: \(t(267) = -72.51\), \(p < .001\)). The same was true for letter selections in pretend games (pretend first: \(t(232) = -53.04\), \(p < .001\); non-pretend first: \(t(267) = -65.57\), \(p < .001\)). Letters selected by pretenders had a higher overall frequency compared to letters selected by non-pretenders (pretend first: \(t(232) = -2.41\), \(p = .017\); non-pretend first: \(t(267) = -5.43\), \(p < .001\)). Comparing data from the first condition only in a between-subject manner revealed a significant difference (\(\Delta M = -0.52\), 95% CI \([-0.77, -0.28]\), \(t(453.21) = -4.25\), \(p < .001\)).
When focusing on misses only, pretend letter selections were again more aligned with the frequency of letters in English words than were non-pretend letter selections ( pretend first: \(t(228) = -0.79\), \(p = .433\); non-pretend first: \(t(257) = 5.36\), \(p < .001\); first block only: \(\Delta M = -0.98\), 95% CI \([-1.31, -0.64]\), \(t(489.98) = -5.80\), \(p < .001\)).
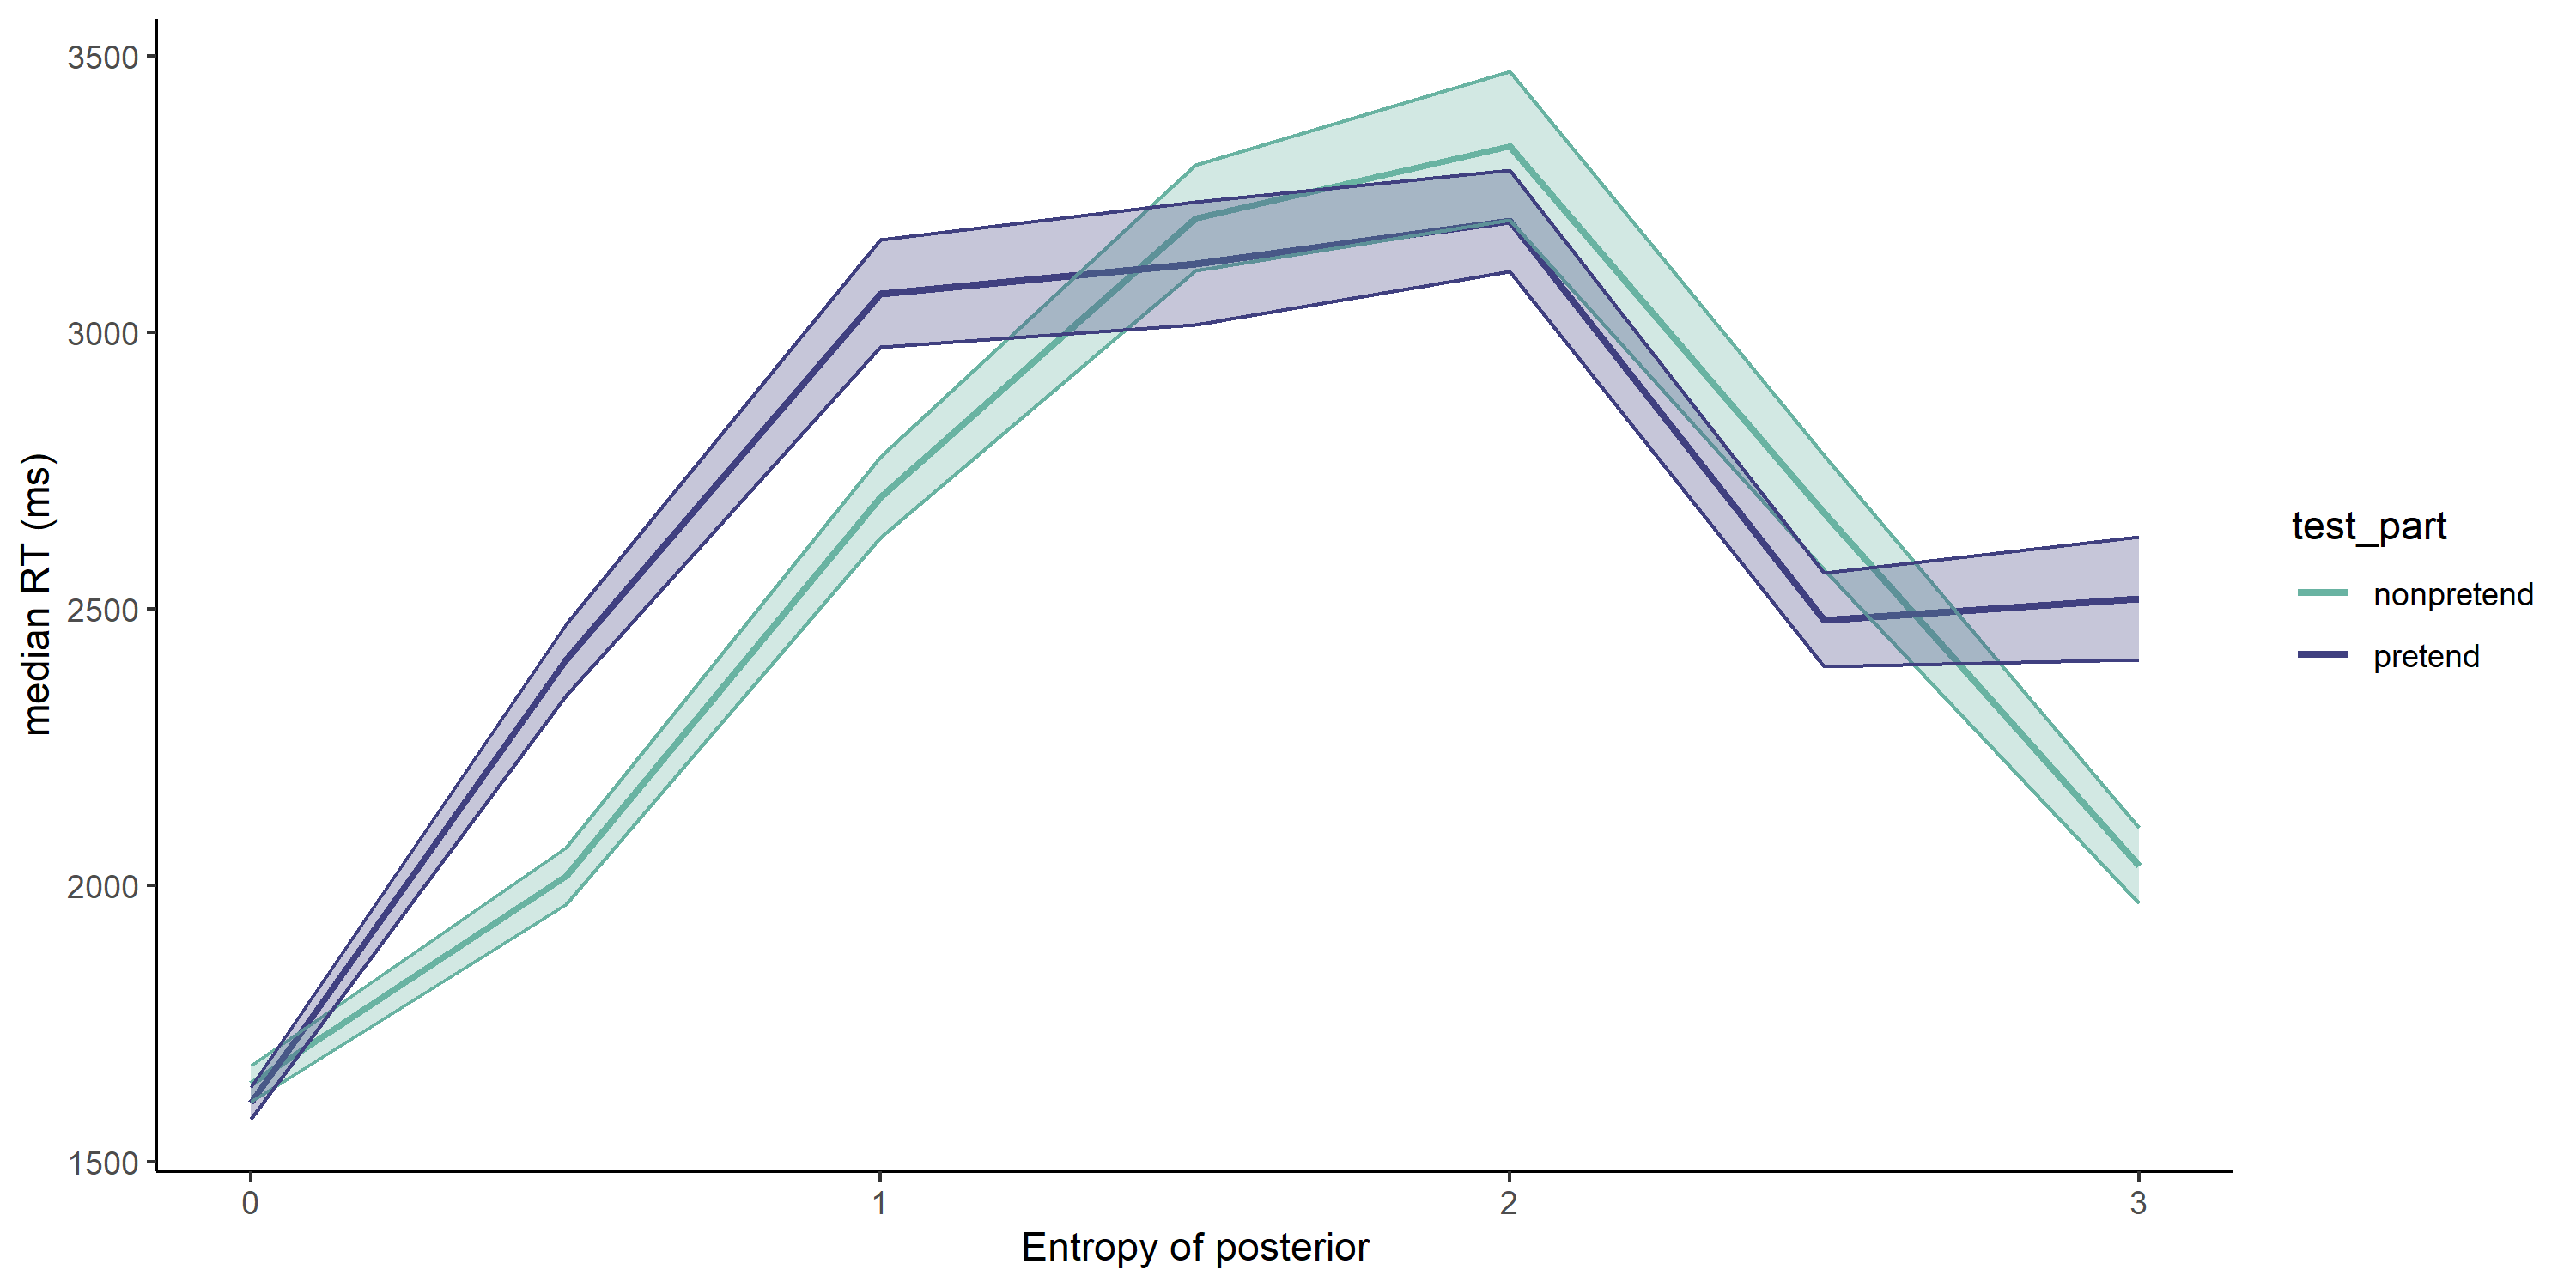
2.2.10 Hypothesis 8 (Entropy/RT relationship)
In non-pretend games, high uncertainty was associated with longer decision times (pretend-first group: \(t(232) = 9.50\), \(p < .001\); pretend-second group: \(t(267) = 10.68\), \(p < .001\)). The same was true for pretend games (pretend-first group: \(t(232) = 4.66\), \(p < .001\); pretend-second group: \(t(267) = 7.65\), \(p < .001\)). The effects were significantly weaker in pretend games (pretend-first group: \(t(232) = -2.51\), \(p = .013\); pretend-second group: \(t(232) = -2.51\), \(p = .013\)).
In non-pretend games, the relationship between uncertainty and RT was negatively quadratic, such that the longest responses were the one associated with intermediate uncertainty levels (pretend-first group: \(t(232) = -7.75\), \(p < .001\); pretend-second group: \(t(232) = -7.75\), \(p < .001\)). The same was true for pretend games (pretend-first group: \(t(232) = -1.79\), \(p = .075\); pretend-second group: \(t(267) = -3.43\), \(p = .001\)). The effects were significantly weaker in pretend games (pretend-first group: \(t(232) = 3.72\), \(p < .001\); pretend-second group: \(t(232) = 3.72\), \(p < .001\)).
2.2.11 Hypothesis 9 (judge accuracy):
Participants were not significantly above chance in judging whether the presented game came from a pretender or from a genuine player (\(M = 0.51\), 95% CI \([0.49, 0.53]\), \(t(452) = 0.57\), \(p = .568\)). This was the case also when focusing on words that judges encountered when pretending (\(M = 0.52\), 95% CI \([0.49, 0.55]\), \(t(452) = 1.30\), \(p = .194\)), and when focusing on words that judges encountered when playing normally (\(M = 0.49\), 95% CI \([0.46, 0.52]\), \(t(452) = -0.57\), \(p = .572\)).
Hypothesis 9B (judge bias): Participants were slightly biased to classify games as pretend games (\(M = 0.53\), 95% CI \([0.51, 0.55]\), \(t(452) = 3.46\), \(p = .001\)).
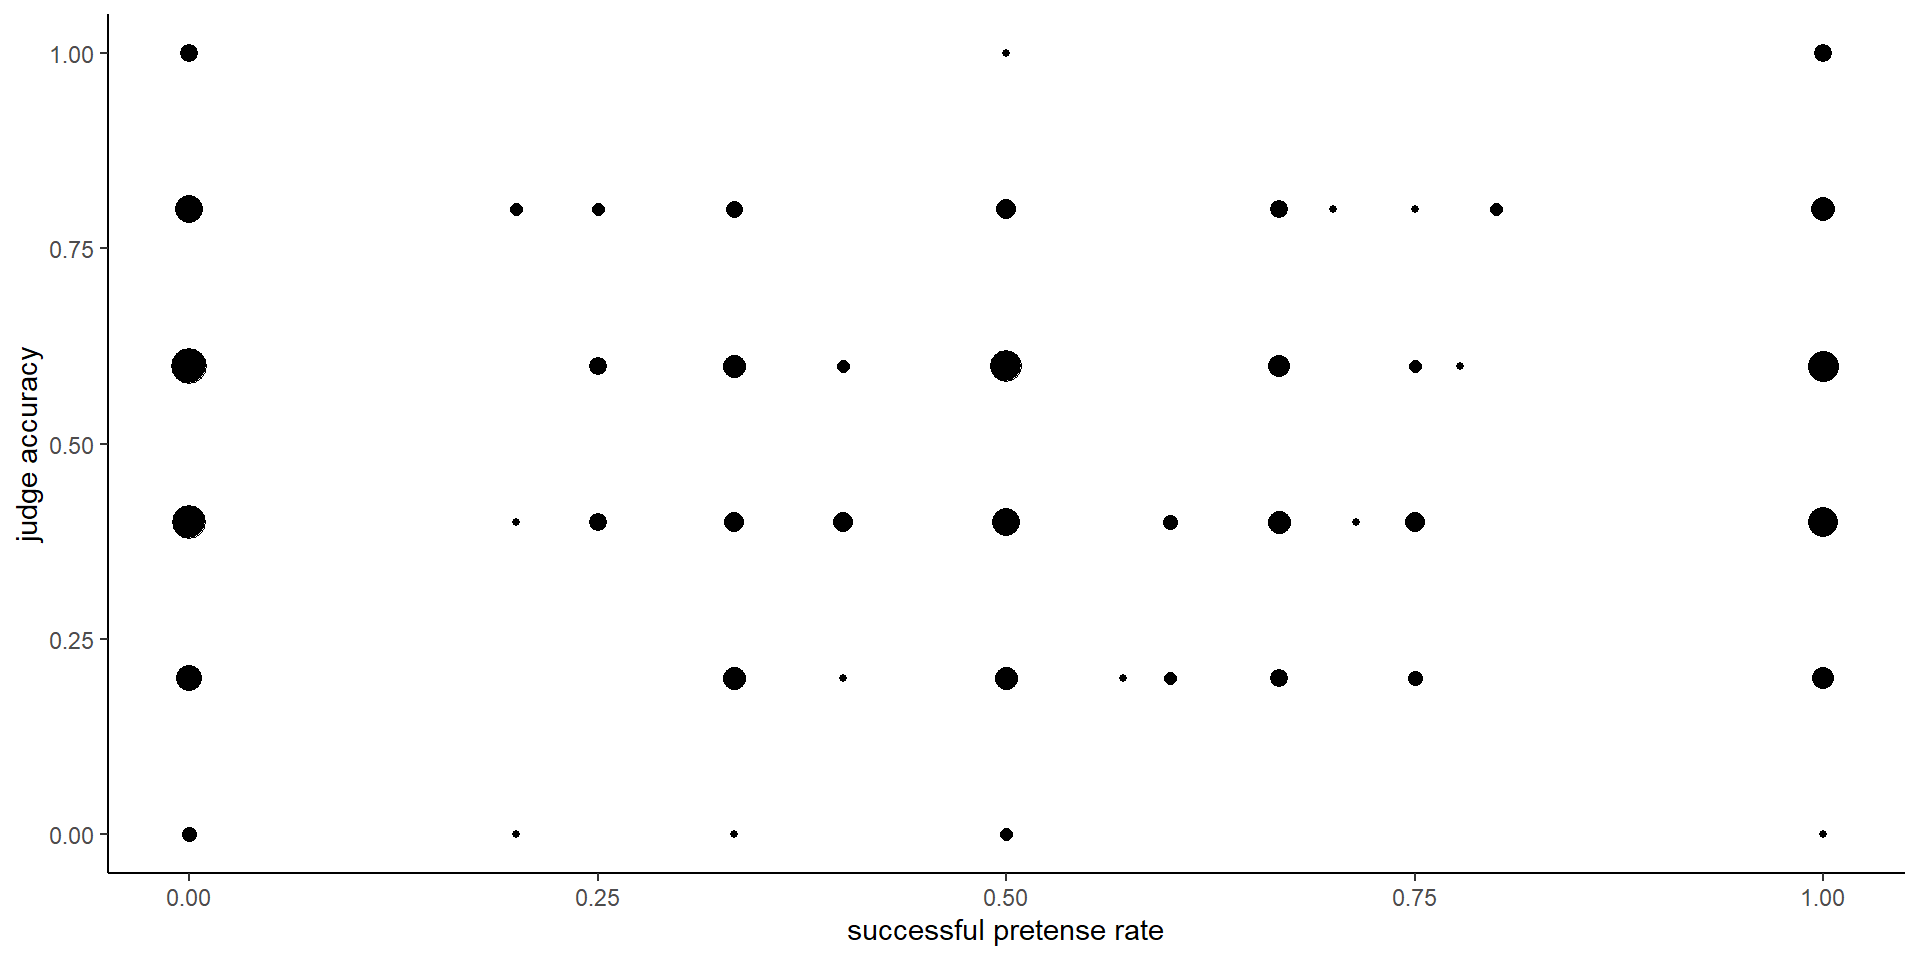
2.2.12 Hypothesis 10 (judge-pretend relation)
No significant correlation between judge accuracy and ability to trick others (\(r_{\mathrm{s}} = .00\), \(S = 5,089,032.77\), \(p = .941\)), nor with the optimality cost to pretending (\(r_{\mathrm{s}} = -.10\), \(S = 5,613,970.32\), \(p = .082\)).
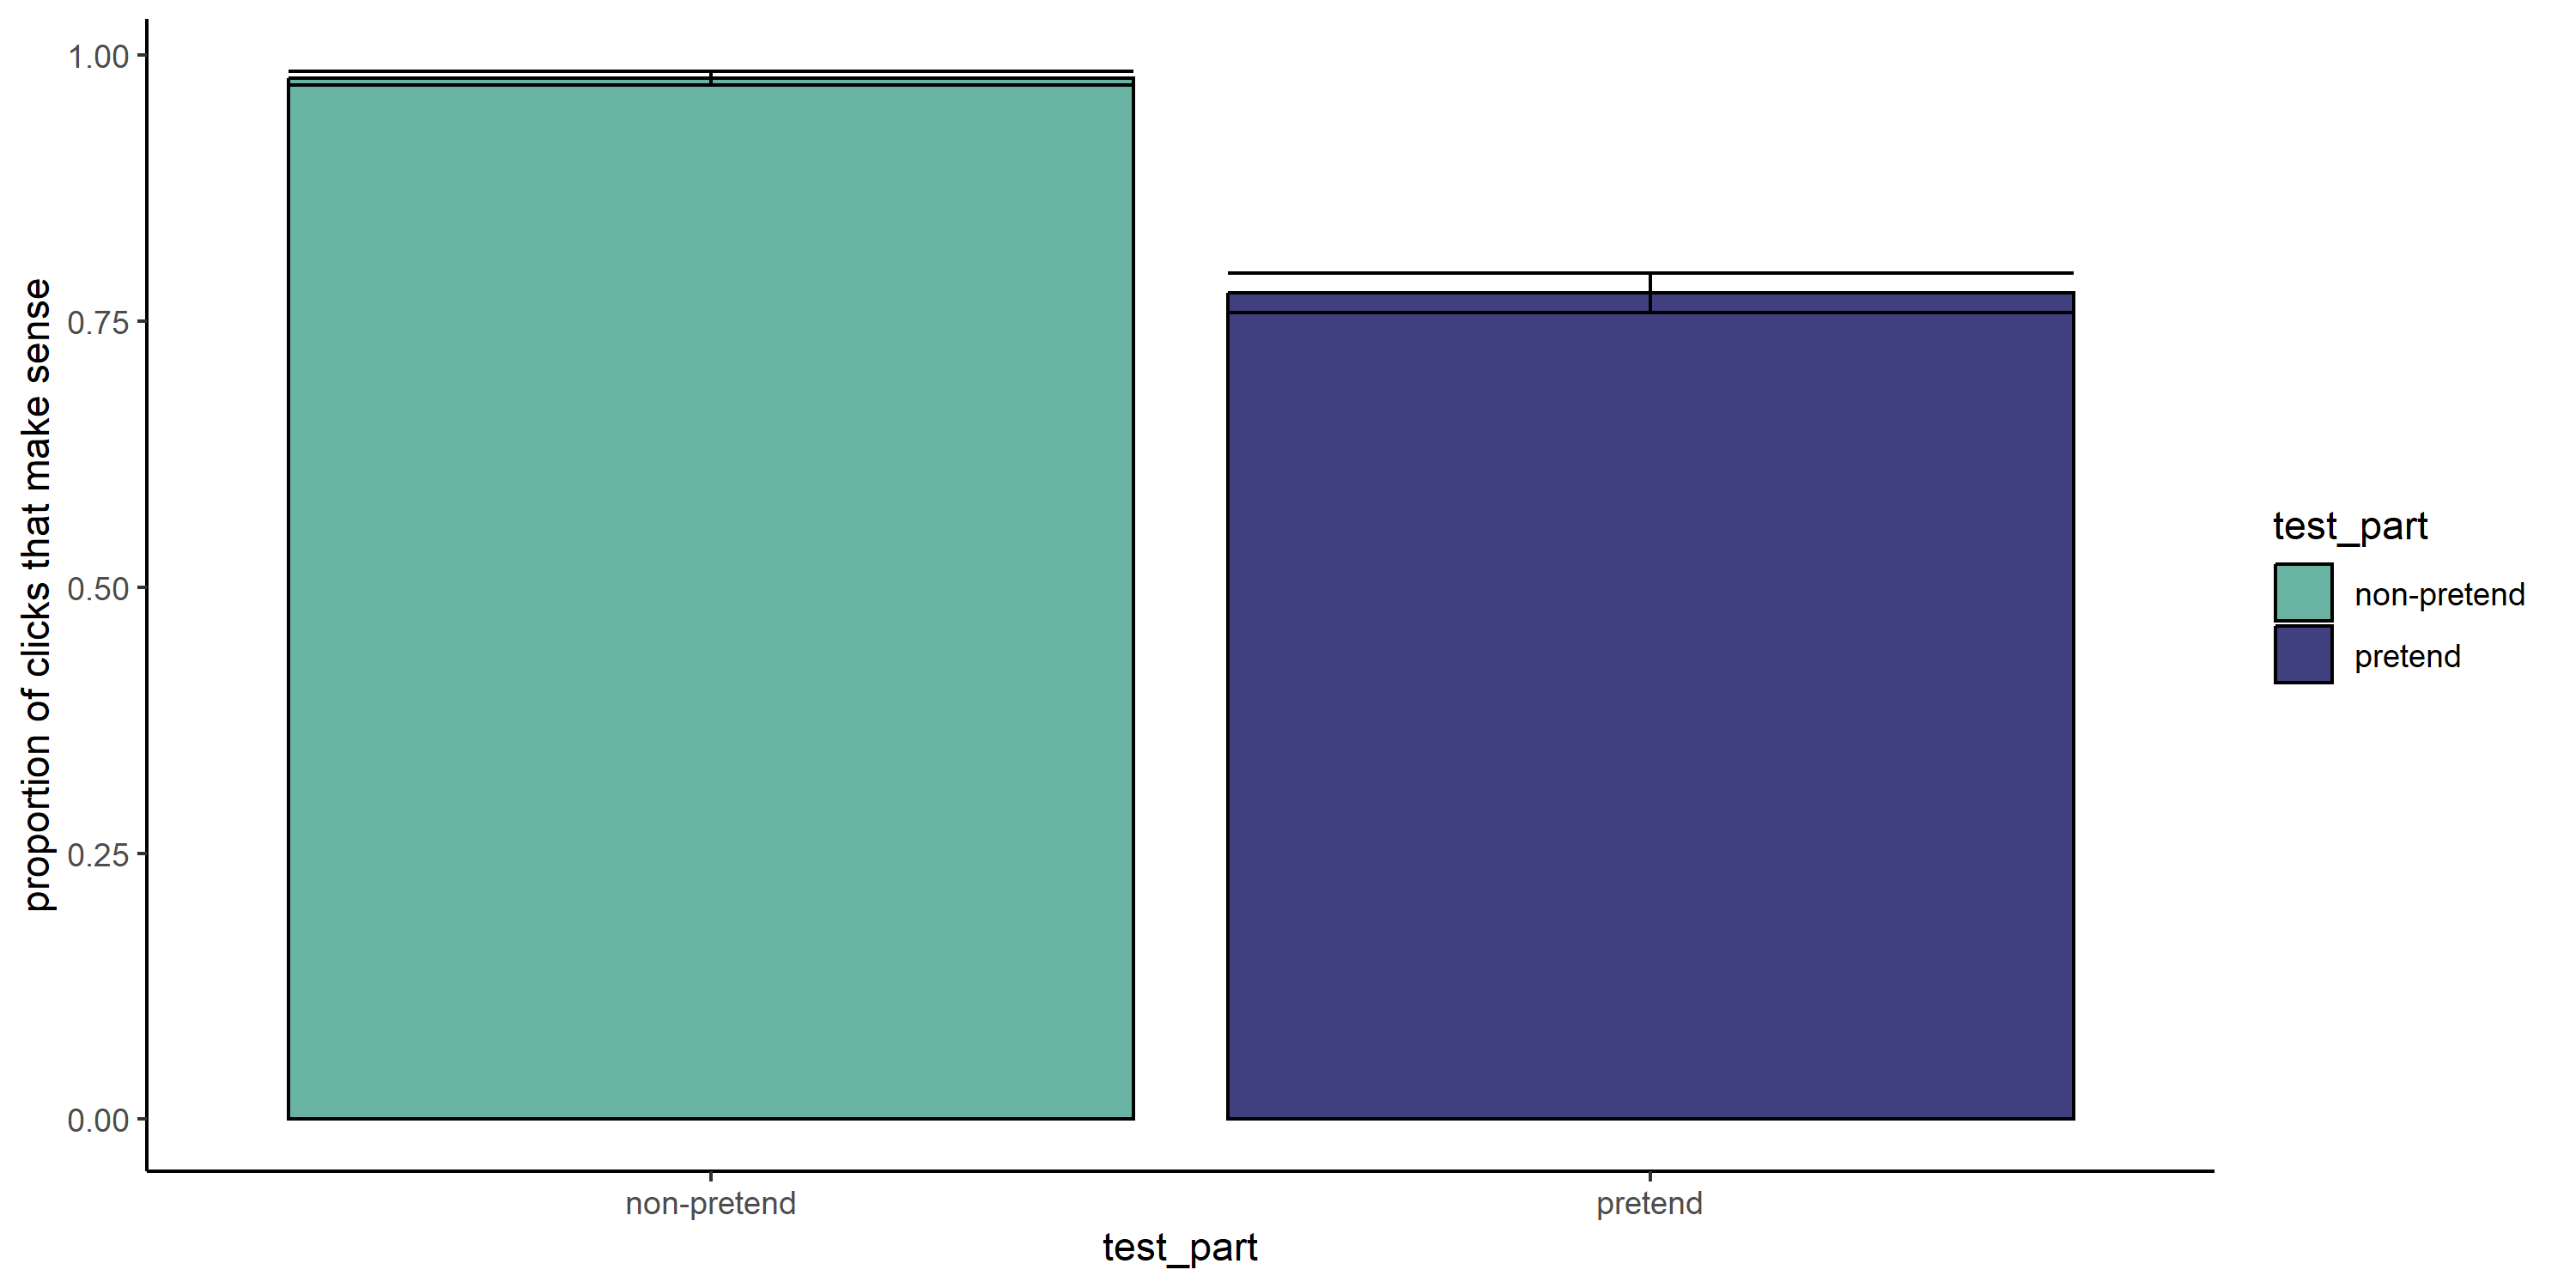
2.2.13 Hypothesis 12 (irrational letter selections in half-games)
In non-pretend games, subjects almost always chose letters that made sense, that is, that were consistent with at least one word that matched the presented category and game state (pretend-first group: 0.97; pretend-second group: 0.98). In pretend games, these figures were significantly lower (pretend-first group: 0.73, \(p<.001\); pretend-second group: 0.82, \(p<.001\)).
2.2.14 Hypothesis 13 (target word effect in half-games)
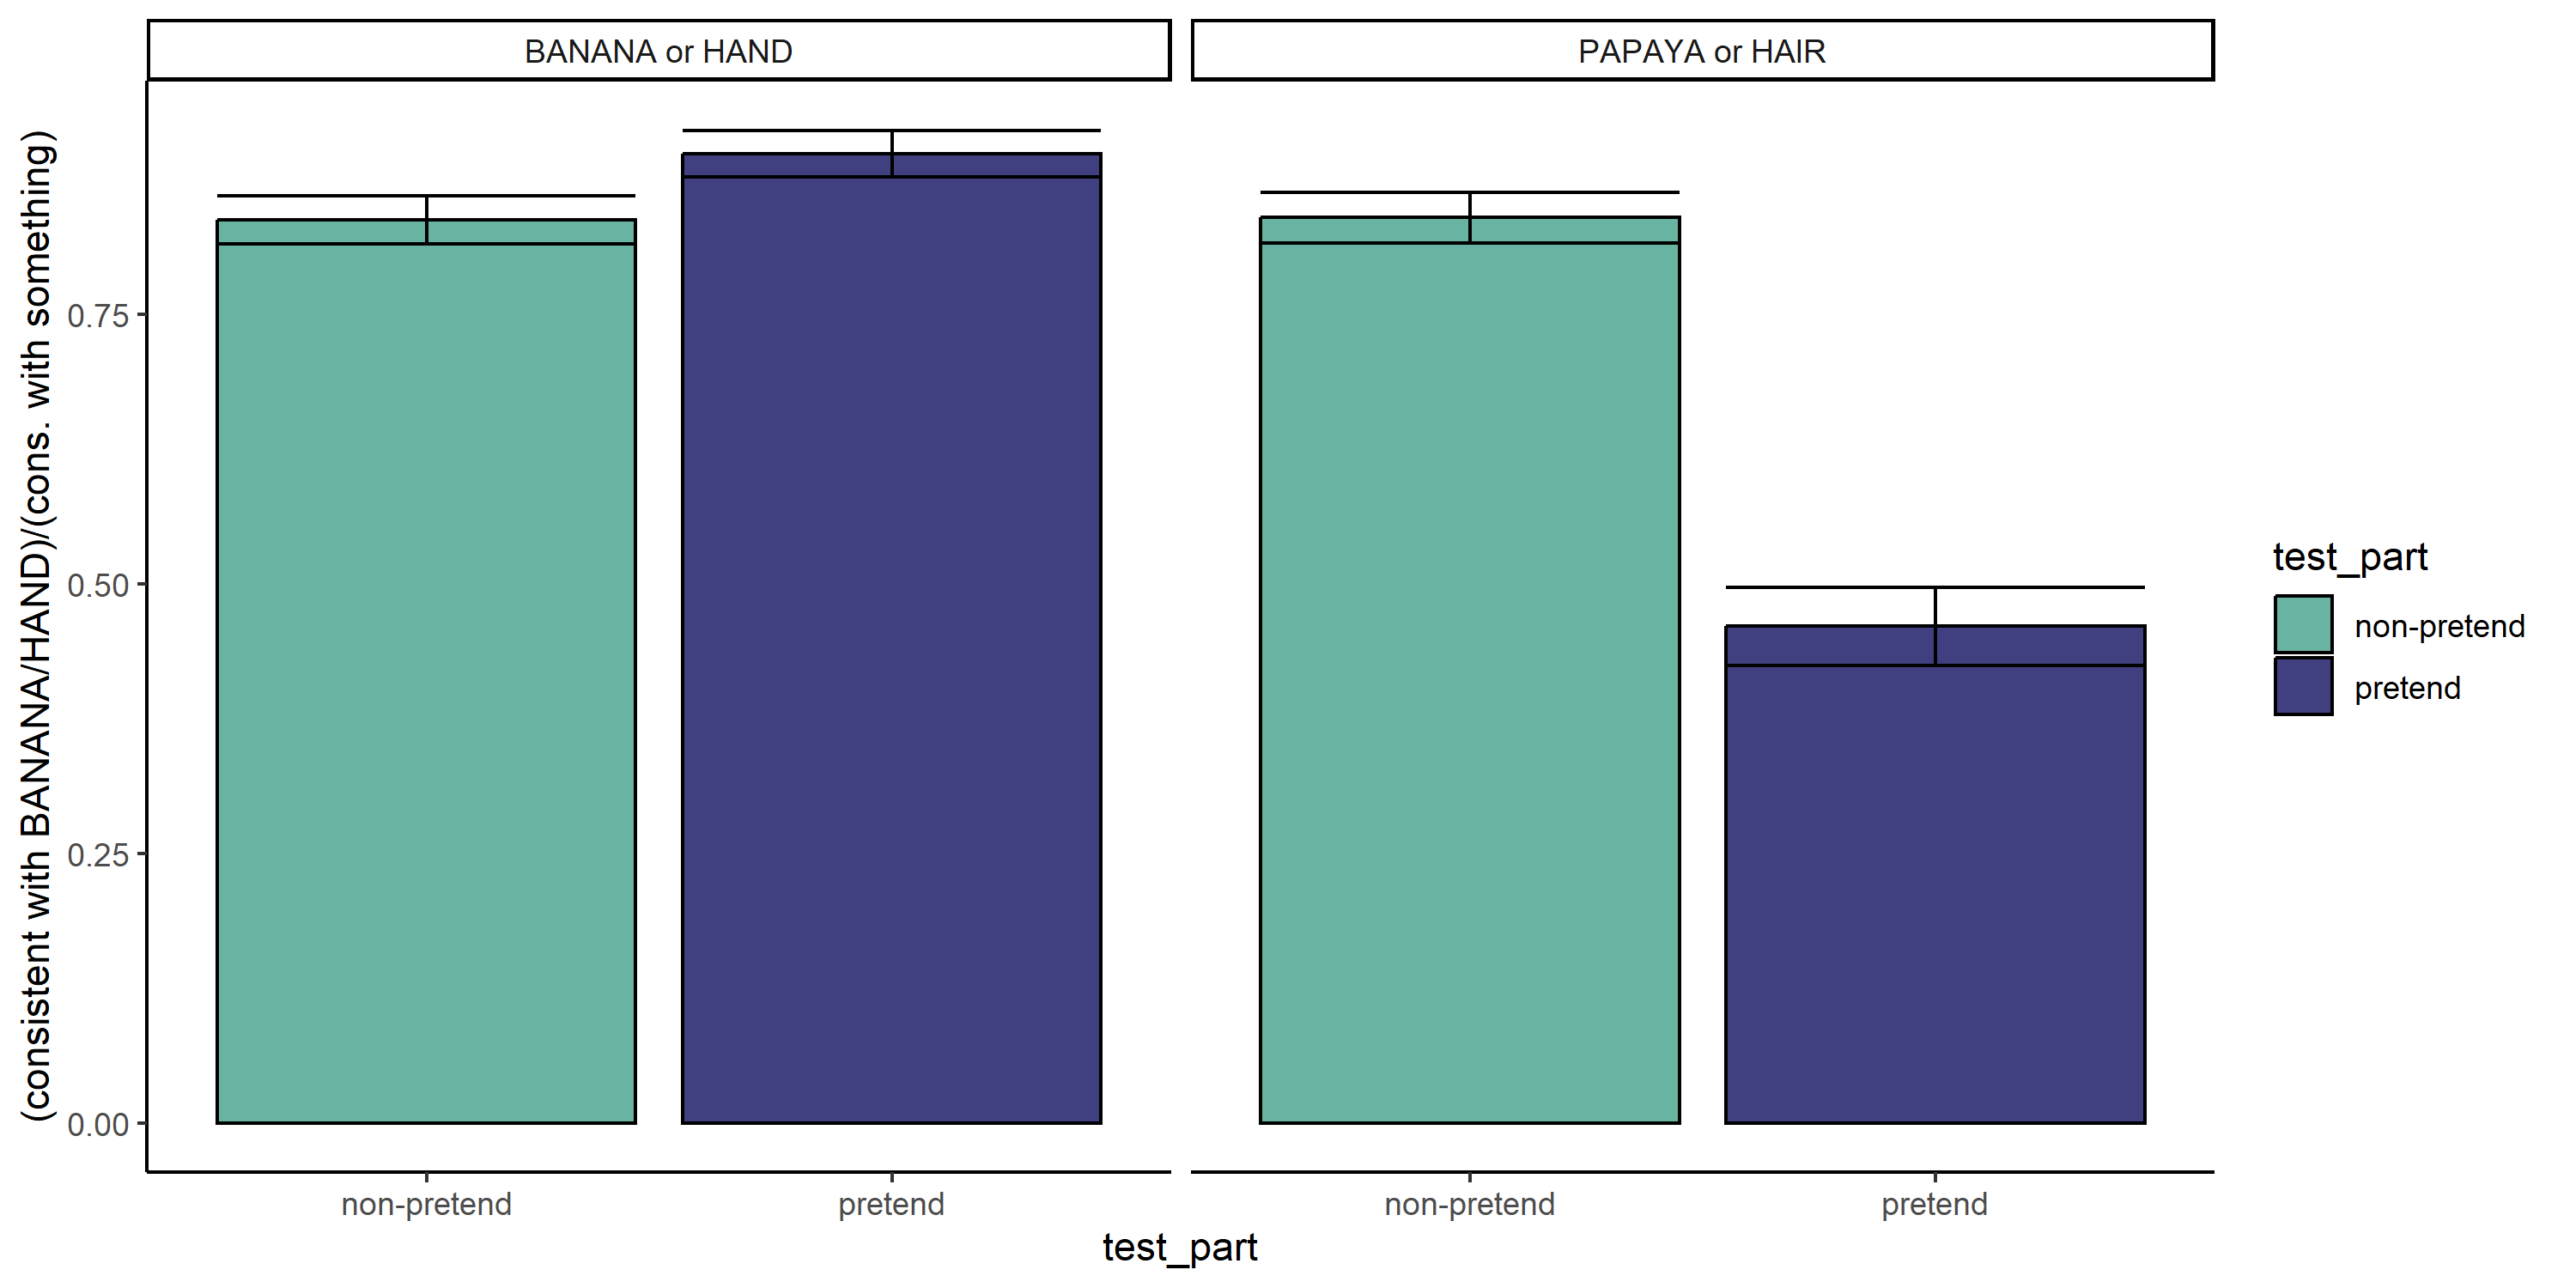
Excluding irrational clicks, non-pretenders had an overall preference to select letters that are consistent with the words ‘BANANA’ and ‘HAND’ (pretend-first group: 0.82; pretend-second group: 0.86). Pretenders’ preference for the same letters was weaker (pretend-first group: 0.66, \(p<.001\); pretend-second group: 0.70, \(p<.001\)).
Within pretend games, preference for letters that are consistent with HAND or BANANA was significantly stronger when the word itself was BANANA or HAND, compared to when it was PAPAYA or HAIR (pretend-first group: 0.80 vs. 0.52, \(p<.001\); pretend-second group: 0.97 vs. 0.41, \(p<.001\)).