Pretending not to know: pre-registered analyses
1 Exp. 1: Battleship
1.1 Methods
We report how we determined our sample size, all data exclusions (if any), all manipulations, and all measures in the study.
A detailed pre-registration can be accessed at osf.io/v9zsb. The pre-registration was time-locked using cryptographic randomization-based time-locking (Mazor, Mazor, and Mukamel 2019) (protocol sum: 60c270410375e8a192468fc1a0e9c93da60d5e203eb2760b621a8631a26f4c5c; link to relevant lines in experimental code).
1.1.1 Participants
The research complied with all relevant ethical regulations and was approved by the Research Ethics Committee of Johns Hopkins University. 500 Participants were recruited via Prolific (prolific.co) and gave their informed consent prior to their participation. They were selected based on their acceptance rate (>95%) and for being native English speakers. The entire experiment took approximately 20 minutes to complete. Participants’ pay was equivalent to an hourly wage of 9.50 USD, in addition to a bonus payment (0.2 - 2 USD, mean = 0.90).
1.1.2 Procedure
Participants were first instructed that the experiment, based on the game Battleships, had three parts, and that they could accumulate ‘points’ that would later translate to a monetary bonus payment. They were then presented with a leaderboard of previous players, and given the rules of the game:
“In the game Battleships, your task is to sink all ships located in a grid with as few clicks as possible. What makes the game difficult is that you can’t see the ships; all you can see is a grid of squares, and you have to guess where the ships are. To sink a ship, you need to click on all of the squares it is located in. If you hit part of a ship, the square will turn red. If there is no ship in the square, it will turn blue.”
We further explained that in this version of the game, ships can touch corners, but their sides can’t touch. This explanation was accompanied by a visual presentation of legal and illegal ship configurations.
After completing a comprehension question and a practice round, participants completed one ‘pretend’ and one ‘non-pretend’ block, each comprising five full games and one half game (see below for details). The order of pretend and non-pretend blocks was counterbalanced between participants. The allocation of boards (spatial configurations of ships; see Fig. 1A) to conditions was randomized between participants such that exactly one board was played in both pretend and non-pretend conditions, and this common board was different for different participants. The order of boards within a block was fully randomized, with the exception that half-games were always played last.
1.1.2.1 Non-pretend (normal) games
In non-pretend games (Fig. 1B), participants aimed to sink two 2-square patrol boats and one 3-square submarine with as few clicks as possible. An online counter of the number of clicks was displayed on the screen. After each game, feedback was given about the number of clicks and resulting number of points obtained.
1.1.2.2 Pretend games
Participants in pretend games were given the same explanation of Battleships, and played a practice round. However, they were then given an additional twist:
“This time your goal is different. In this round, we’re going to tell you where the ships are, but we want you to act like you don’t know this information. We’ve marked the ships’ locations with a cross, so you’ll know where they are the whole time; but your job is to play the game as if these hints aren’t there. To see how good you are at this, we’re going to compare your games to the games of people who actually had no hints, and see how similar they are. We will measure where and when you clicked; if your clicks look similar to people who played like normal (trying to reveal all ships with as few clicks as possible, but without any hints), you’ll get bonus points. But if your games look different, you won’t get these bonus points. Your number of clicks in this part will not affect your bonus. Only your ability to play like you had no hints.”
We informed participants that both the location and timing of their cell clicks will be measured. After one practice round and one comprehension question, participants played five pretend games (Fig. 1C), followed by one pretend half-game. Each game was followed by a short message, reminding them that a game that looks similar to the games of participants who had no hints would be awarded 10 bonus points.
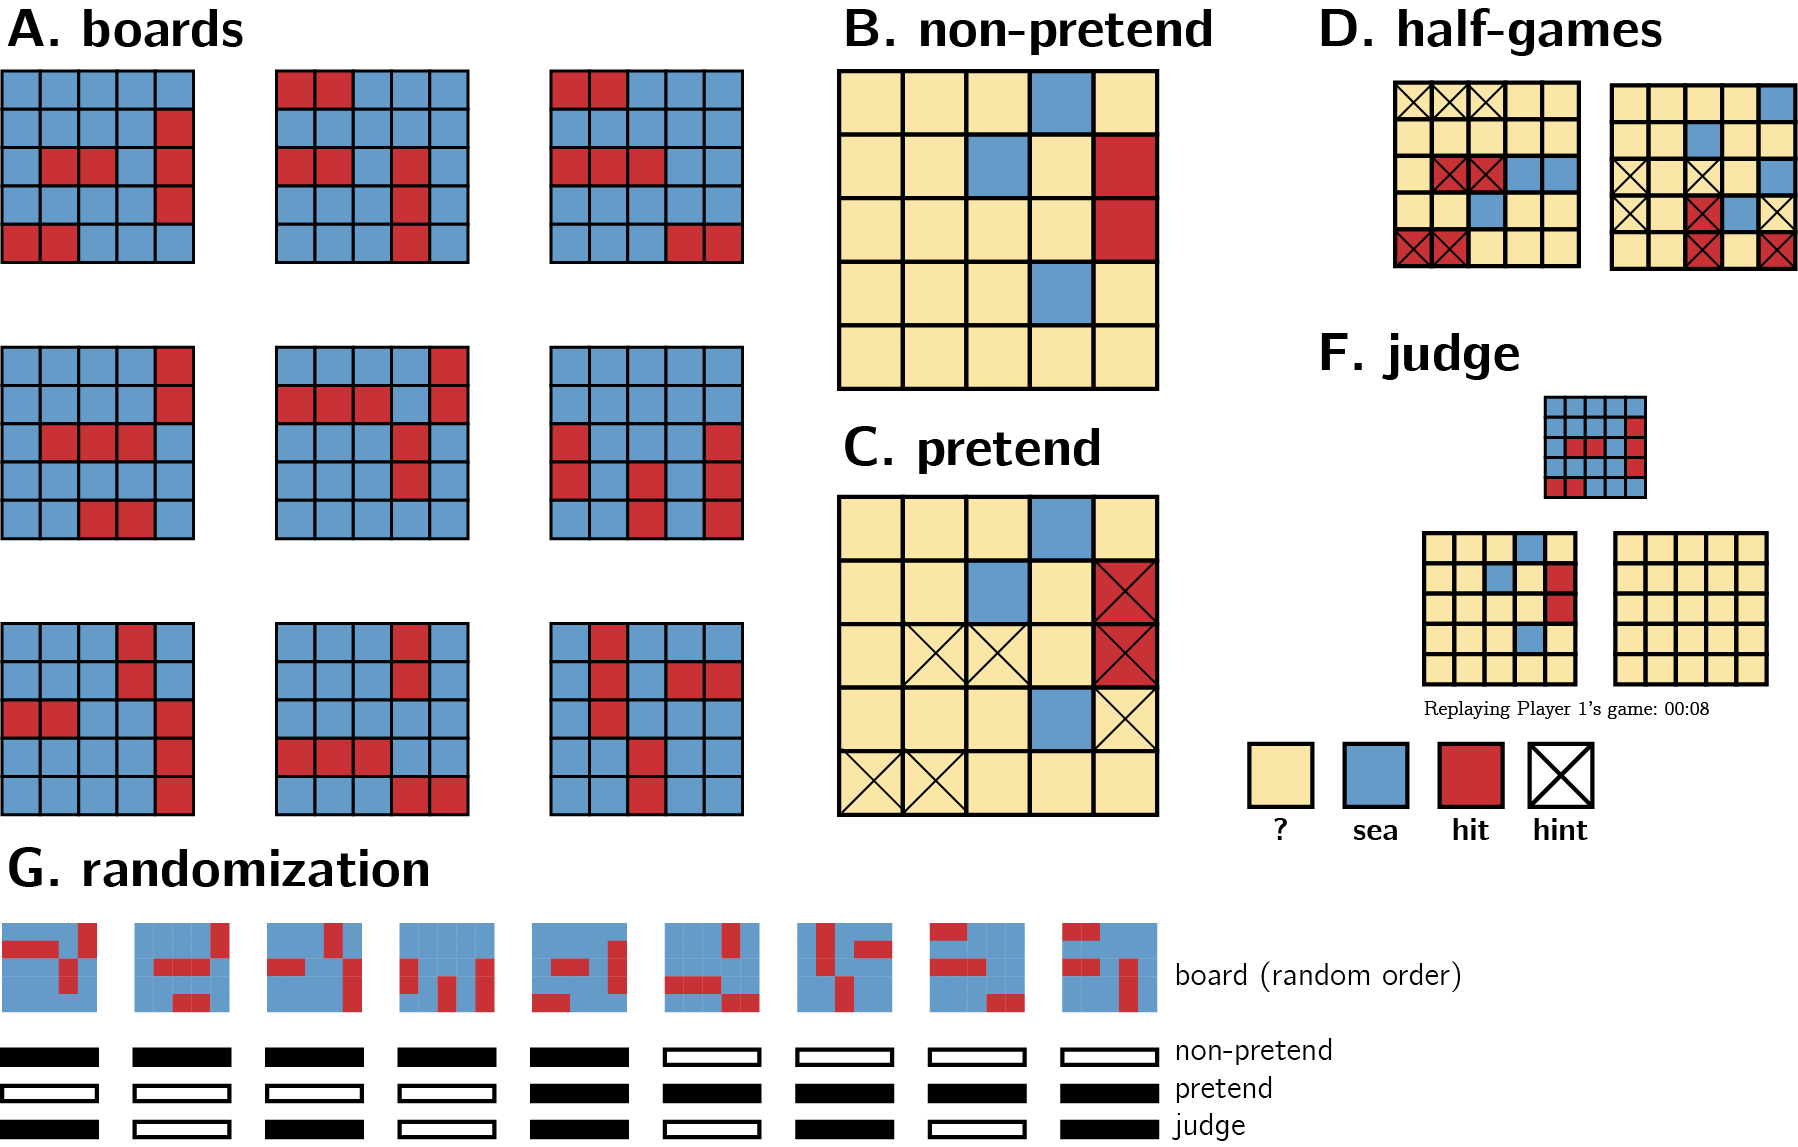
Figure 1.1: Experimental Design. See Methods for details.
1.1.2.3 Half games
In order to directly compare participants’ pretend and non-pretend games for identical belief states (genuine or pretended ignorance about where the ships are hidden), participants completed one pretend and one non-pretend game given a partly finished board with the content of 7 cells already revealed (see Fig. 1D). We designed our half games to produce a strong expectation to find a ship in specific cells, but not in others. The assignment of half-completed boards to pretend and non-pretend conditions was randomized between participants.
1.1.2.4 Judge trials
In the final part of the experiment, participants observed the games of previous players and tried to determine who had hints and who didn’t. On each trial, two empty grids were presented side by side, with a smaller grid on top, displaying the hidden positions of ships on the grid (Fig. 1F). The two grids corresponded to the true games of two previous players who played a version of the top grid either as pretenders or as non-pretenders. Only games shorter than one minute were chosen for presentation in this part. For non-pretend games, only games from the group of participants that pretended in the second block (and played normally in the first block) were chosen for presentation in this part. Judge participants observed a real time replay of the two grids, showing not only where participants clicked, but also when. After making a decision, participants were informed whether they would receive the 10 bonus points, or alternatively, whether the pretender would receive them in the event the pretender managed to trick them.
A more detailed description of the study procedure is provided in the study pre-registration document. Readers are also invited to try a demo of the experiment.
1.2 Results
We designed our analyses to explore subjects’ capacity for self-simulation under a counterfactual knowledge state, and the limits of this capacity. We focused on where subjects clicked and when, and asked whether this differed between pretend and non-pretend games. All analyses were pre-registered unless otherwise specified. In our pre-registration document, we committed to separately analyzing participants according to whether they pretended before or after completing a non-pretend block. Whenever there is a mismatch between the two groups, we focus on the first block of each participant (only pretend games from participants who pretended first, and only standard games from participants who played normally first). We do so to ensure that any successful pretending is not due to memory of one’s own behavior in a previous block, and that non-pretend games are not biased by experience with the pretend block.
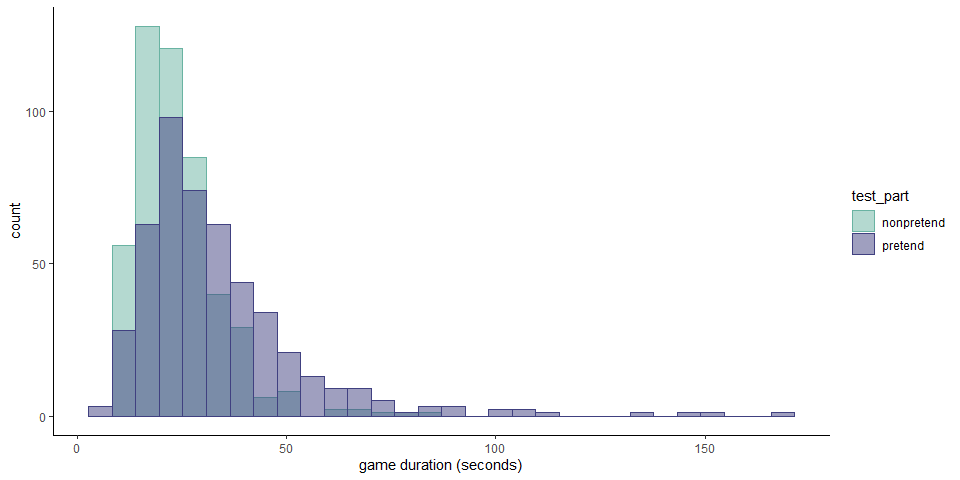
1.2.1 Hypothesis 1 (game duration)
Pretend games were longer than non-pretend games by 6 seconds on average. This was true in the pretend-first group (\(t(233) = 11.59\), \(p < .001\)), and in the pretend-second groups (\(t(245) = 6.41\), \(p < .001\)).
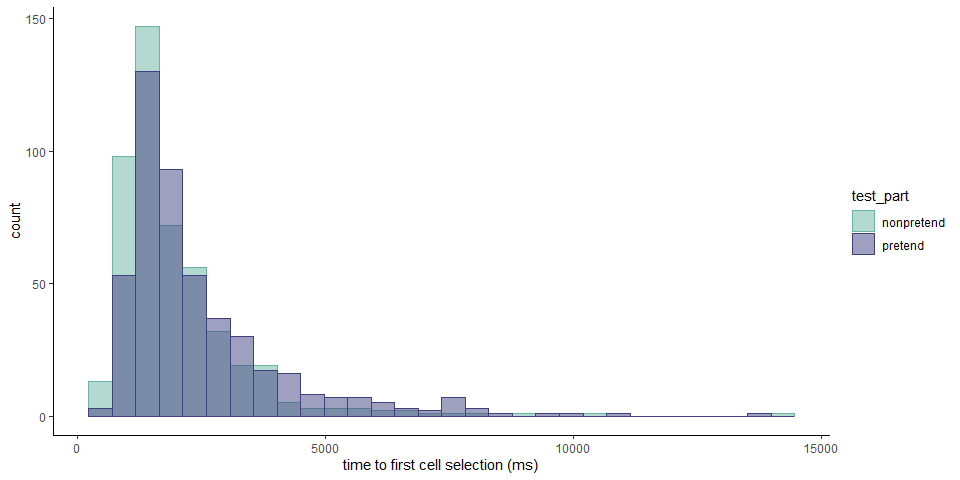
1.2.2 Hypothesis 2 (first click latency)
The first click in pretend games took longer to execute by 321 ms. This was true in the pretend-first group (\(t(233) = 8.24\), \(p < .001\)), but not in the pretend-second groups (\(t(245) = -1.03\), \(p = .306\)). As per our pre-registration document, we focused our analysis on the first blocks only, using a between-subject t-test. This test revealed a significant difference in the first click latency (\(\Delta M = 750.61\), 95% CI \([374.56, 1,126.67]\), \(t(391.22) = 3.92\), \(p < .001\)).
1.2.3 Hypothesis 3 (number of clicks)
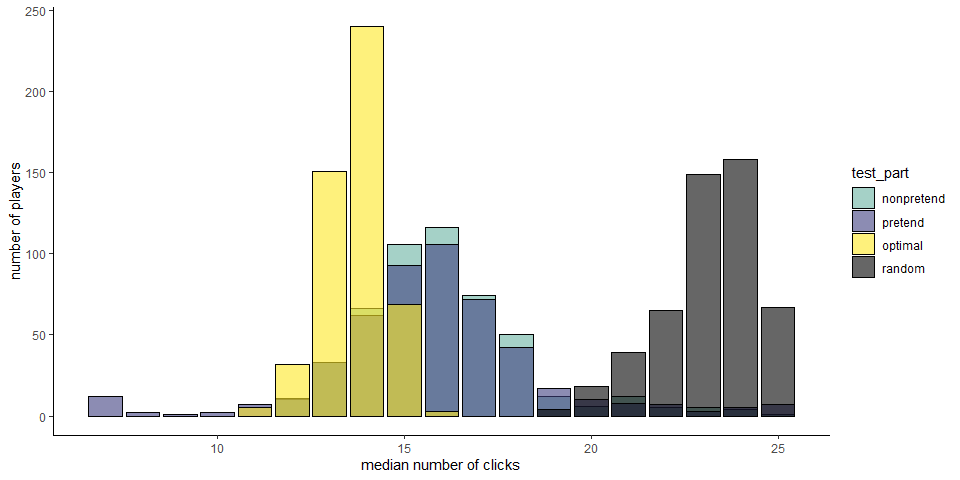
To sink all ships, players had to click on at least 7 and at most 25 squares. A simulated player that clicks randomly had a mean total click number of 22.75, and a near-optimal greedy player that consistently selected the square with the highest objective probability of containing a ship had a mean total click number of 13.62. Among our players, the mean number of clicks was 16.05 in non-pretend games and 15.83 in pretend games.
No significant difference in the total number of clicks was observed in the pretend-first group (\(t(243) = 1.43\), \(p = .153\)), but a significant difference was observed in the pretend-second group (\(t(255) = -3.71\), \(p < .001\)). Note that the two effects point in opposite directions, reflecting a tendency to make fewer clicks in the second block of the game. Crucially, when focusing on the first block only, We observed no significant difference in the number of clicks between the two conditions (\(t(440.10) = 0.41\), \(p = .682\)).
In 62 pretend games from 20 players, games were completed after 7 clicks only, without ever missing a ship. This never happened in non-pretend games. We assumed that these participants did not follow the task instructions, and excluded them from all analyses.
1.2.4 Hypothesis 4 (click latency by outcome)
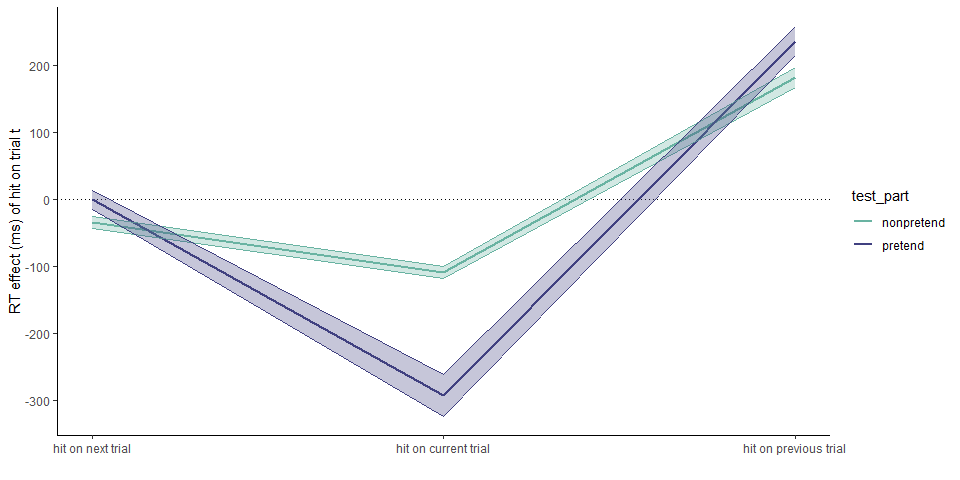
In non-pretend games, cell selections that resulted in a hit were faster by 109 ms. than those that resulted in a miss (pretend-first group: \(t(233) = -8.73\), \(p < .001\); pretend-second group: \(t(245) = -8.80\), \(p < .001\)).
In pretend games, cell selections that resulted in a hit were faster by 293 ms. than those that resulted in a miss (pretend-first group: \(t(233) = -11.83\), \(p < .001\); pretend-second group: \(t(245) = -11.32\), \(p < .001\)). The effect of hitting versus missing a ship was significantly stronger in pretend games (pretend-first group: \(t(233) = -8.90\), \(p < .001\); pretend-second group: \(t(245) = -6.20\), \(p < .001\)).
1.2.5 Hypothesis 5 (click latency by previous outcome)
In non-pretend games, cell selections that followed a hit were slower by 182 ms. than those that followed a miss (pretend-first group: \(t(233) = 10.83\), \(p < .001\); pretend-second group: \(t(245) = 8.19\), \(p < .001\)).
In pretend games, cell selections that followed in a hit were slower by 236 ms. than those that followed a miss (pretend-first group: \(t(233) = 7.96\), \(p < .001\); pretend-second group: \(t(245) = 9.52\), \(p < .001\)). The effect of following a hit versus a miss was significantly stronger in pretend games only in the pretend-second group (\(t(245) = 2.70\), \(p = .007\); pretend-first group: \(t(233) = 1.40\), \(p = .162\)). Crucially, the effect was significantly stronger when focusing on the first blocks only (\(t(377.12) = 2.75\), \(p = .006\)).
1.2.6 Hypothesis 6 (click latency by next outcome)
In non-pretend games, cell selections that preceded a hit were slower than those that preceded a miss only in the group that played normally first (pretend-second group: \(M = -78.17\), 95% CI \([-103.34, -53.00]\), \(t(245) = -6.12\), \(p < .001\)), but not in the group that pretended first (\(M = 4.57\), 95% CI \([-22.11, 31.26]\), \(t(233) = 0.34\), \(p = .736\)).
In pretend games, the timing of cell selections did not covary with the outcomes of future cell selections (pretend-first group: \(t(233) = 1.13\), \(p = .261\); pretend-second group: \(t(245) = 1.43\), \(p = .155\)). The effect of the next outcome was significantly weaker in pretend games only in the pretend-second group (\(t(245) = 3.95\), \(p < .001\)) but not in the pretend-first group (\(t(233) = 0.94\), \(p = .346\)). Crucially, the effect was significantly weaker when focusing on the first blocks only (\(t(301.81) = 3.26\), \(p = .001\)).
1.2.7 Model based analysis
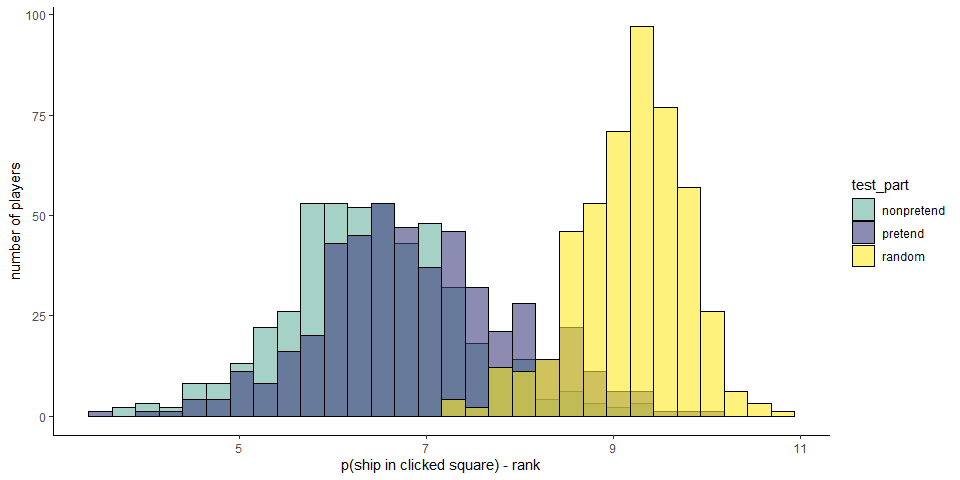
Pretend games were similar to non pretend games in the total number of clicks — but were they also similar in where participants clicked? More specifically, did cell selections in pretend games make sense given the limited information those participants pretended to have? To ask this, we approximated optimal behavior by calculating the probability that a ship is hidden in each cell given available information, \(p(ship(x_{i}))\), and the posterior probability that one should click on a square, assuming a uniform prior over cells \(P(x_{i})=\frac{p(Ship(x_i))}{\sum_{j=1}^{k}p(Ship(x_j))}\). Critically, in modeling pretend games we did not treat hints as part of this available information for extracting \(p(ship(x_{i}))\), because an optimal player should ignore hints in choosing where to click next. Given this posterior map, a rational player should choose cells where \(P(x_{i})\) is high [this behavior is not strictly optimal, but approximates optimal behavior in most cases; Audinot, Bonnet, and Viennot (2014), Section 3.3]. To quantify optimality, before each cell selection we computed the posterior probability map for all ‘unknown’ cells. Then, we ranked cells from high to low according to their posterior probability and recorded the rank of the chosen cell: a lower rank indicating more optimal behavior.
1.2.8 Hypothesis 7 (game optimality)
The mean posterior rank of non-pretend cell selections was 6.44 and significantly lower (more optimal) than that of a simulated random agent (9.19, \(t(479) = -49.18\), \(p < .001\)). Pretend games were significantly less optimal than non-pretend games (6.93; pretend-first group: \(t(233) = 8.49\), \(p < .001\); pretend-second group: \(t(245) = 7.11\), \(p < .001\)), but still more optimal than those of a random agent (\(t(479) = -38.51\), \(p < .001\)). Critically, the same pattern was observed when restricting analysis to cell selections that resulted in a miss (non-pretend - pretend: \(t(469.71) = -6.30\), \(p < .001\); pretend - random: \(t(479) = -10.25\), \(p < .001\)). In other words, the optimality of pretend games relative to random cell selection was not merely due to the fact that pretenders clicked on ships more than expected by chance. Even when missing a ship, their cell selections made sense given the limited information they pretended to have.
1.2.9 Hypothesis 8 (entropy-RT relation)
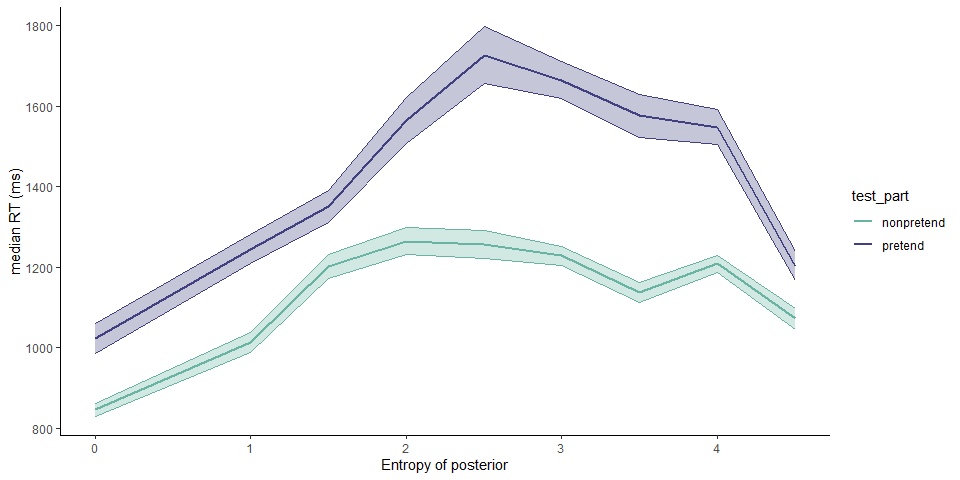
When playing Battleships, it is sometimes clear what the next cell selection should be, and sometimes more difficult to decide where to click next. To capture this notion of decision uncertainty, we calculated the entropy of the posterior distribution over cell selections \(H(P)=-\sum_{i=1}^{k}P(x_i) \log P(x_{i})\), where \(P(x_{i})=\frac{p(Ship(x_i))}{\sum_{j=1}^{k}p(Ship(x_j))}\), and asked how this measure relates to decision latency, or the time taken to click on the next cell. \(H(P)\) is high when players need to decide between multiple cells with a similar probability of hiding a ship, and low when there are only a few candidates with a high probability of hiding a ship. For every player and condition separately, we fitted a multiple linear regression to predict decision latency based on \(H(P)\) and \(H(P)^2\). The resulting coefficients were then subjected to a group-level inference. The first cell selection of each game was excluded from this analysis, because entropy was constant for the first click.
In non-pretend games, we found no evidence for a linear relation between decision entropy and decision latency among participants who played normally in the first block (\(t(245) = -0.06\), \(p = .950\)). In contrast, a significantly negative linear modulation was observed in the group that pretended in the first and played normally in the second block (\(t(233) = -10.24\), \(p < .001\)).
In pretend games, this negative relation between \(H(P)\) and click latency was significant in both groups (pretend-first group: \(t(233) = -4.93\), \(p < .001\); pretend-second group: \(t(245) = -5.54\), \(p < .001\)). We found no significant difference between the magnitude of the linear effect in pretend and non-pretend games (pretend-first group: \(t(233) = 0.63\), \(p = .528\); pretend-second group: \(t(245) = -1.77\), \(p = .079\)).
Similarly, we found no evidence for a quadratic relation between decision entropy and decision latency in non-pretend games of participants who played normally in the first block (\(t(245) = -1.33\), \(p = .184\)). Again, a significantly negative quadratic modulation was observed in the non-pretend games of players who pretended in the first and played normally in the second block (\(t(233) = -13.26\), \(p < .001\)). Like the linear effect, this negative quadratic relation was significant in the pretend games of both groups (pretend-first group: \(t(233) = -10.21\), \(p < .001\); pretend-second group: \(t(245) = -12.14\), \(p < .001\)). This negative quadratic effect was stronger in pretend compared to non-pretend games (pretend-first group: \(t(233) = -4.32\), \(p < .001\); pretend-second group: \(t(245) = -3.49\), \(p = .001\)).
1.2.10 Hypothesis 9 (judge accuracy)
Participants were not significantly above chance in judging which of the two presented games came from a pretender (mean accuracy: 51%; t test against 50: \(t(499) = 1.45\), \(p = .147\)).
For a subset of 288 players, one of the five boards presented in the judging block was already presented both in the pretend and in the non-pretend blocks. Still, even this subset of participants who had just experienced a board both as pretenders and as non-pretenders were not significantly above chance in telling which of two other players had hints for this same board (mean accuracy: 55%, \(p=.141\)).
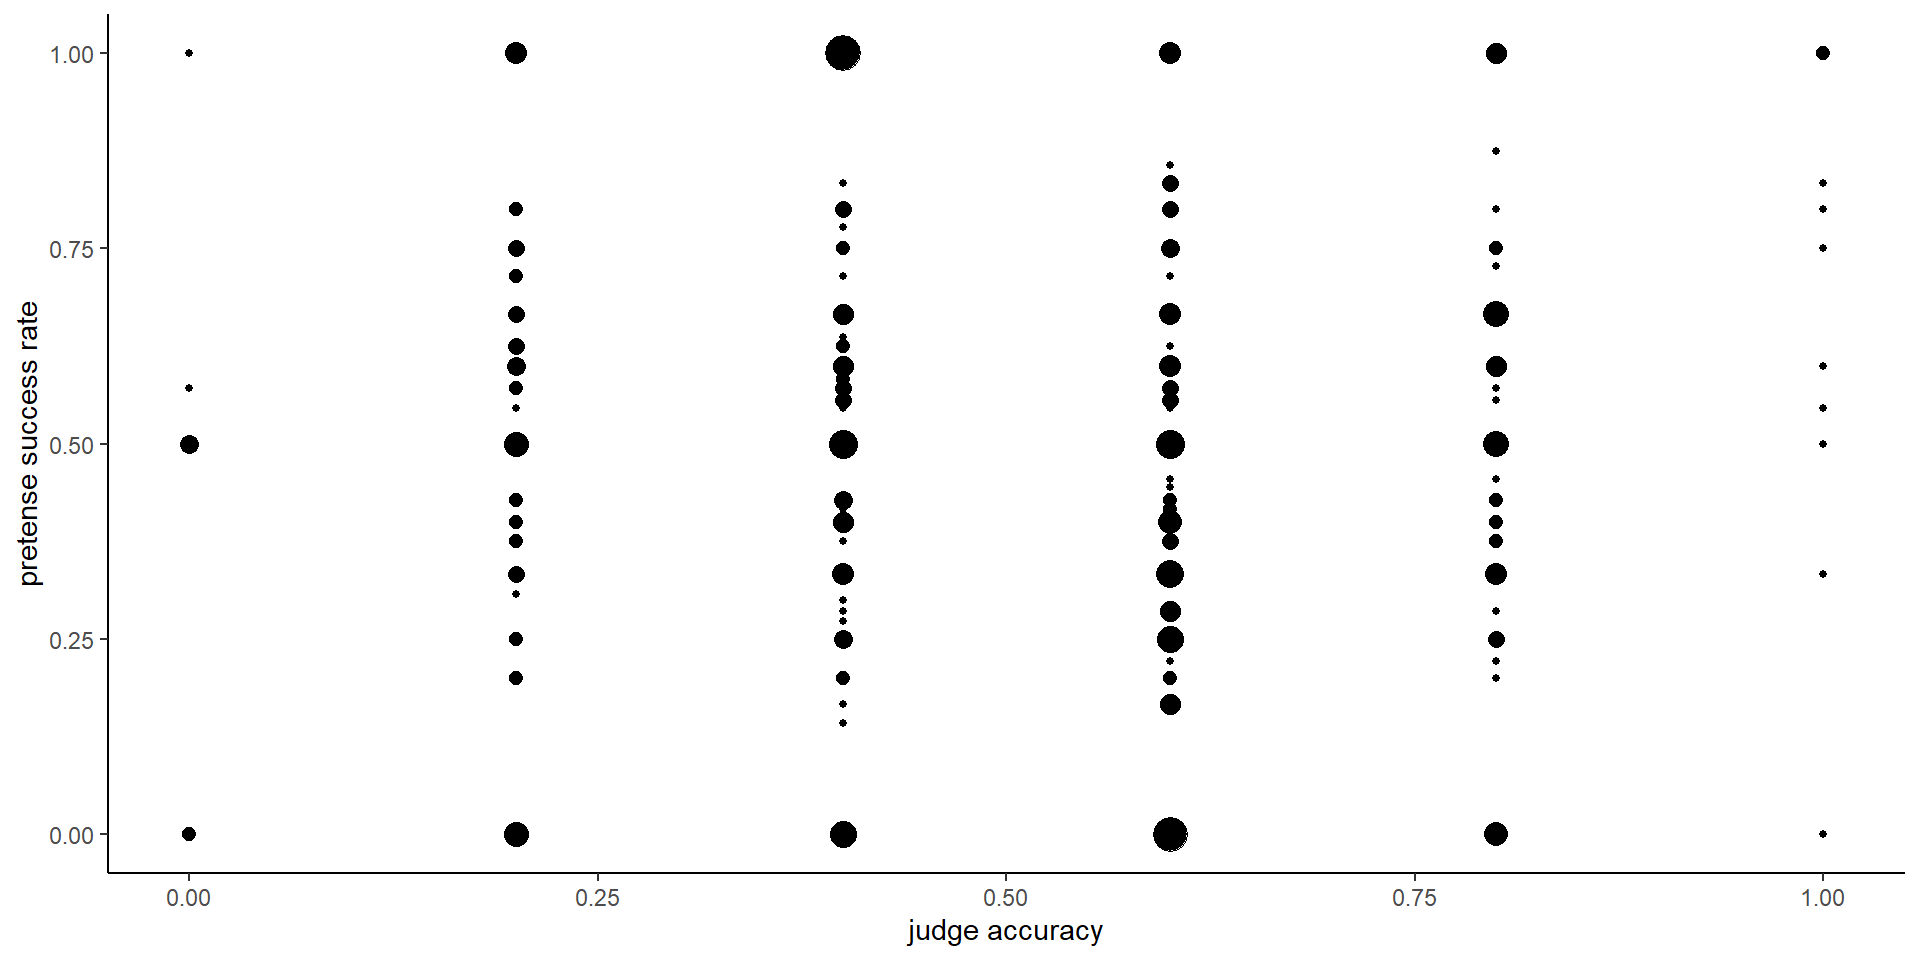
1.2.11 Hypothesis 10 (judge-pretend relation)
Pretense quality was quantified as the number of pretend games that were misclassified by other participants as non-pretend games, divided by the number of pretend games that were presented to other participants. Due to randomization, this denominator is different for different participants. We tested for a correlation between pretense quality and judge accuracy at the group level. To maximize statistical power, this hypothesis was tested on the pooled data from both groups of participants. We find no evidence for such a correlation (\(r_{\mathrm{s}} = -.05\), \(S = 7,779,376.67\), \(p = .328\)). Furthermore, we find no significant correlation between participants’ accuracy in detecting the pretender and their decision optimality in pretend games (measured as the mean rank posterior probability of their cell selections; \(r_{\mathrm{s}} = .02\), \(S = 17,999,242.64\), \(p = .608\)), nor with the cost to optimality relative to non-pretend games (\(r_{\mathrm{s}} = .02\), \(S = 18,089,259.81\), \(p = .685\)).